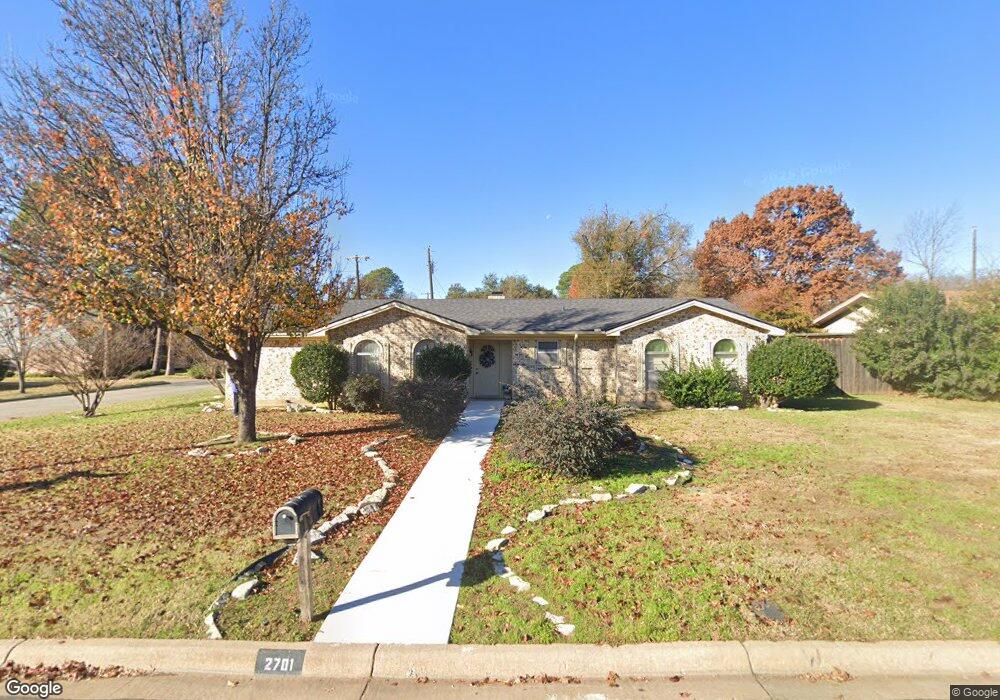
2701 Bedfordshire Bedford, TX 76021
Estimated Value: $400,991 - $422,000
4
Beds
3
Baths
1,993
Sq Ft
$208/Sq Ft
Est. Value
About This Home
This home is located at 2701 Bedfordshire, Bedford, TX 76021 and is currently estimated at $414,498, approximately $207 per square foot. 2701 Bedfordshire is a home located in Tarrant County with nearby schools including Shady Brook Elementary School, Harwood Junior High School, and Trinity High School.
Ownership History
Date
Name
Owned For
Owner Type
Purchase Details
Closed on
Feb 24, 2005
Sold by
Foster Laurence and Foster Mary
Bought by
Toney Clifford and Toney Sherron
Current Estimated Value
Home Financials for this Owner
Home Financials are based on the most recent Mortgage that was taken out on this home.
Original Mortgage
$152,605
Outstanding Balance
$77,879
Interest Rate
5.71%
Mortgage Type
FHA
Estimated Equity
$336,619
Purchase Details
Closed on
Sep 3, 1999
Sold by
Pitts Thomas James and Pitts Sharon
Bought by
Foster Laurence and Foster Mary
Home Financials for this Owner
Home Financials are based on the most recent Mortgage that was taken out on this home.
Original Mortgage
$96,000
Interest Rate
10.75%
Create a Home Valuation Report for This Property
The Home Valuation Report is an in-depth analysis detailing your home's value as well as a comparison with similar homes in the area
Home Values in the Area
Average Home Value in this Area
Purchase History
| Date | Buyer | Sale Price | Title Company |
|---|---|---|---|
| Toney Clifford | -- | First American Title | |
| Foster Laurence | -- | Safeco Land Title |
Source: Public Records
Mortgage History
| Date | Status | Borrower | Loan Amount |
|---|---|---|---|
| Open | Toney Clifford | $152,605 | |
| Previous Owner | Foster Laurence | $96,000 | |
| Closed | Foster Laurence | $18,000 |
Source: Public Records
Tax History Compared to Growth
Tax History
| Year | Tax Paid | Tax Assessment Tax Assessment Total Assessment is a certain percentage of the fair market value that is determined by local assessors to be the total taxable value of land and additions on the property. | Land | Improvement |
|---|---|---|---|---|
| 2025 | $1,605 | $321,186 | $75,000 | $246,186 |
| 2024 | $1,605 | $321,186 | $75,000 | $246,186 |
| 2023 | $4,883 | $259,000 | $75,000 | $184,000 |
| 2022 | $5,055 | $231,460 | $75,000 | $156,460 |
| 2021 | $6,222 | $264,140 | $75,000 | $189,140 |
| 2020 | $6,057 | $283,169 | $75,000 | $208,169 |
| 2019 | $5,626 | $275,070 | $75,000 | $200,070 |
| 2018 | $3,013 | $210,538 | $75,000 | $135,538 |
| 2017 | $4,630 | $231,581 | $25,000 | $206,581 |
| 2016 | $4,209 | $178,559 | $25,000 | $153,559 |
| 2015 | $2,562 | $159,571 | $25,000 | $134,571 |
| 2014 | $2,562 | $143,800 | $25,000 | $118,800 |
Source: Public Records
Map
Nearby Homes
- 37 Devonshire Dr
- 1630 Post Oak Dr
- 1723 Post Oak Dr
- 22 Lincolnshire Cir
- 2901 Miles Way
- 1601 Warwickshire Ct W
- 2524 Shady Ridge Dr
- 2503 Shady Ridge Dr
- 1704 Indian Oaks Ct
- 1636 Bedford Oaks Dr
- 2112 Oakmeadow Place
- 1401 Danielle Dr
- 2109 Oakmeadow St
- 2024 Oakmeadow St
- 2508 Lakeview Dr
- 31 Morrow Dr
- 49 Morrow Dr
- 2700 Shady Grove Dr
- 2704 Shady Grove Dr
- 2501 Shady Grove Dr
- 2705 Bedfordshire
- 2 Yorkshire
- 1712 Lincolnshire Dr
- 6 Yorkshire
- 1708 Lincolnshire Dr
- 2700 Bedfordshire
- 2709 Bedfordshire
- 2704 Bedfordshire
- 10 Yorkshire
- 1704 Lincolnshire Dr
- 1800 Lincolnshire Dr
- 2708 Bedfordshire
- 1641 Bedfordshire
- 1805 Lincolnshire Dr
- 2713 Bedfordshire
- 1700 Lincolnshire Dr
- 14 Yorkshire
- 1625 Staffordshire Ct
- 1 Yorkshire
- 1804 Lincolnshire Dr