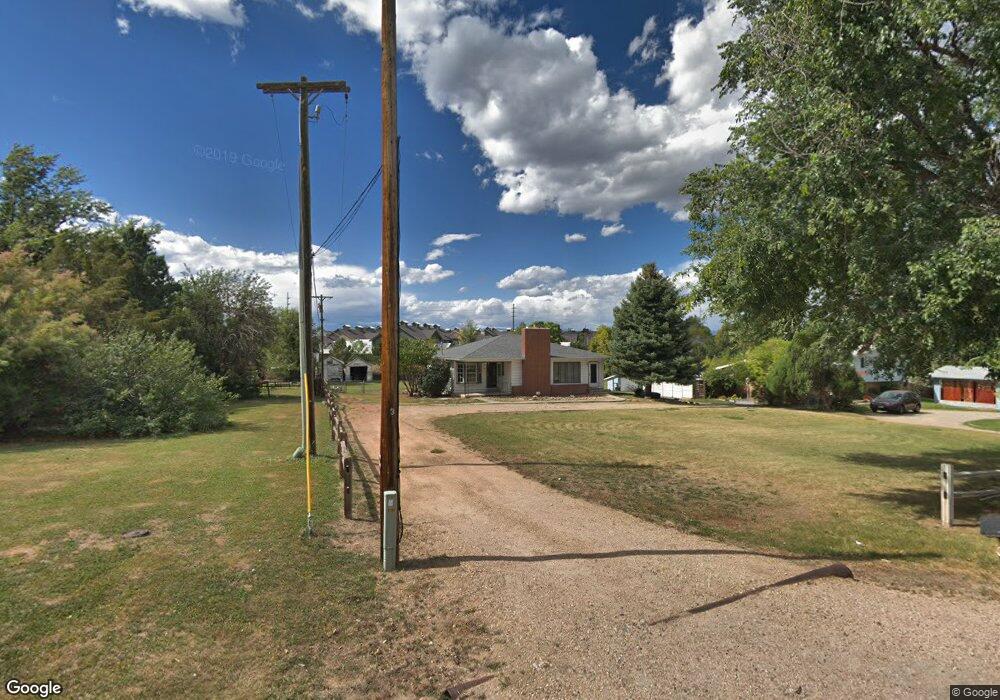
2701 East St Louisville, CO 80027
Estimated Value: $721,907 - $842,000
1
Bed
1
Bath
1,440
Sq Ft
$543/Sq Ft
Est. Value
About This Home
This home is located at 2701 East St, Louisville, CO 80027 and is currently estimated at $782,227, approximately $543 per square foot. 2701 East St is a home located in Boulder County with nearby schools including Lafayette Elementary School, Angevine Middle School, and Centaurus High School.
Ownership History
Date
Name
Owned For
Owner Type
Purchase Details
Closed on
Aug 20, 2025
Sold by
Fanger Kevin B and Fanger Kerry A
Bought by
Stoddard Vanessa and Peterson Daniel
Current Estimated Value
Home Financials for this Owner
Home Financials are based on the most recent Mortgage that was taken out on this home.
Original Mortgage
$747,862
Outstanding Balance
$747,214
Interest Rate
6.72%
Mortgage Type
FHA
Estimated Equity
$35,013
Purchase Details
Closed on
May 22, 2002
Sold by
Fanger Kevin B
Bought by
Fanger Kevin B and Fanger Kerry A
Home Financials for this Owner
Home Financials are based on the most recent Mortgage that was taken out on this home.
Original Mortgage
$165,000
Interest Rate
6.92%
Purchase Details
Closed on
Oct 30, 1992
Bought by
Fanger Kevin B and Fanger Kerry A
Purchase Details
Closed on
Apr 25, 1991
Bought by
Fanger Kevin B and Fanger Kerry A
Purchase Details
Closed on
Aug 31, 1987
Bought by
Fanger Kevin B and Fanger Kerry A
Purchase Details
Closed on
Oct 8, 1986
Bought by
Fanger Kevin B and Fanger Kerry A
Create a Home Valuation Report for This Property
The Home Valuation Report is an in-depth analysis detailing your home's value as well as a comparison with similar homes in the area
Home Values in the Area
Average Home Value in this Area
Purchase History
| Date | Buyer | Sale Price | Title Company |
|---|---|---|---|
| Stoddard Vanessa | $800,000 | Land Title | |
| Fanger Kevin B | -- | Land Title Guarantee Company | |
| Fanger Kevin B | -- | -- | |
| Fanger Kevin B | -- | -- | |
| Fanger Kevin B | $85,800 | -- | |
| Fanger Kevin B | $24,800 | -- |
Source: Public Records
Mortgage History
| Date | Status | Borrower | Loan Amount |
|---|---|---|---|
| Open | Stoddard Vanessa | $747,862 | |
| Previous Owner | Fanger Kevin B | $165,000 |
Source: Public Records
Tax History Compared to Growth
Tax History
| Year | Tax Paid | Tax Assessment Tax Assessment Total Assessment is a certain percentage of the fair market value that is determined by local assessors to be the total taxable value of land and additions on the property. | Land | Improvement |
|---|---|---|---|---|
| 2025 | $3,392 | $40,538 | $30,475 | $10,063 |
| 2024 | $3,392 | $40,538 | $30,475 | $10,063 |
| 2023 | $3,330 | $40,803 | $33,688 | $10,800 |
| 2022 | $2,943 | $33,332 | $25,270 | $8,062 |
| 2021 | $2,902 | $34,291 | $25,997 | $8,294 |
| 2020 | $2,567 | $29,930 | $21,808 | $8,122 |
| 2019 | $2,524 | $29,930 | $21,808 | $8,122 |
| 2018 | $2,277 | $27,950 | $21,960 | $5,990 |
| 2017 | $2,202 | $30,901 | $24,278 | $6,623 |
| 2016 | $1,948 | $23,880 | $19,104 | $4,776 |
| 2015 | $1,838 | $22,081 | $7,960 | $14,121 |
| 2014 | $1,748 | $22,081 | $7,960 | $14,121 |
Source: Public Records
Map
Nearby Homes
- 187 Rendezvous Dr
- 329 Lodgewood Ln
- 313 Caribou Pass Cir
- 2437 Waneka Lake Trail
- 2758 Meadow Mountain Trail
- 2509 Ravenwood Ln
- 2856 Shadow Lake Rd
- 2849 Crater Lake Ln
- 2305 Glacier Ct
- 2313 Glacier Ct
- 714 Skywalker Point
- 2325 Glacier Ct
- 9224 Baseline Rd
- 1362 Golden Eagle Way
- 2020 Highway 42
- 1312 Snowberry Ln Unit 103
- 1304 Snowberry Ln Unit 202
- 1304 Snowberry Ln Unit 103
- 2524 Concord Cir
- 1308 Snowberry Ln Unit 103
- 595 N 96th St
- 2545 Stonewall Ln
- 619 N 96th St
- 619 N 96th St
- 2553 Stonewall Ln
- 2435 Windrow Ln
- 2561 Stonewall Ln
- 2536 Stonewall Ln
- 2399 High Lonesome Trail
- 2425 Windrow Ln
- 2544 Stonewall Ln
- 2445 Windrow Ln
- 2577 Stonewall Ln
- 238 Rendezvous Dr
- 246 Rendezvous Dr
- 2403 High Lonesome Trail
- 2560 Stonewall Ln
- 230 Rendezvous Dr
- 2585 Stonewall Ln
- 254 Rendezvous Dr