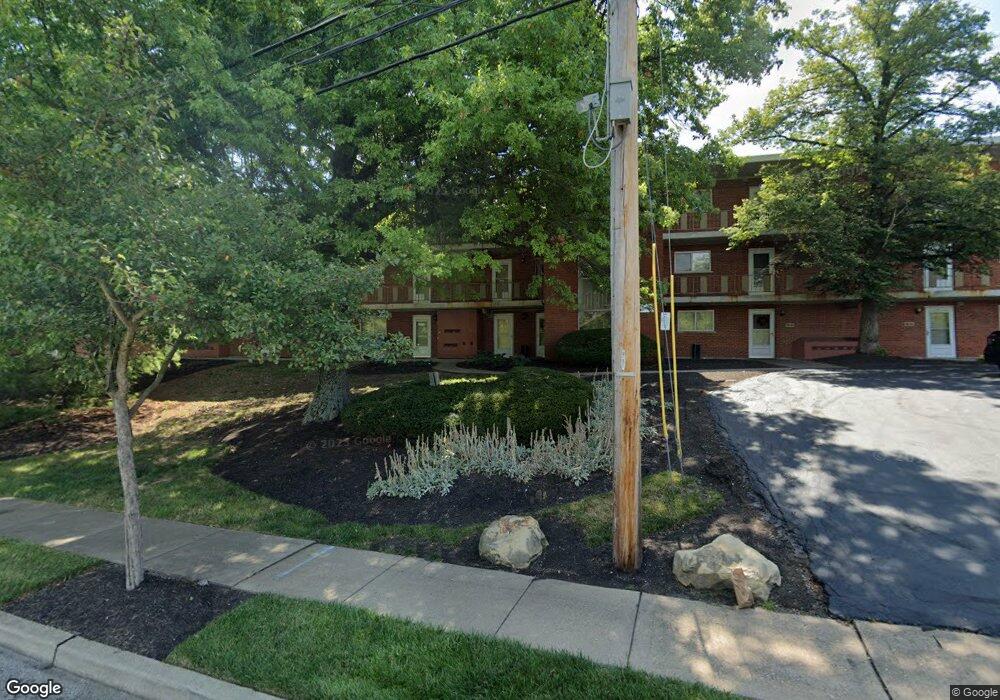
The Residences at Summit View 2701 Lehman Rd Unit A13 Cincinnati, OH 45204
East Price Hill NeighborhoodEstimated Value: $81,000 - $96,000
2
Beds
1
Bath
672
Sq Ft
$135/Sq Ft
Est. Value
About This Home
This home is located at 2701 Lehman Rd Unit A13, Cincinnati, OH 45204 and is currently estimated at $90,735, approximately $135 per square foot. 2701 Lehman Rd Unit A13 is a home located in Hamilton County with nearby schools including Oyler School, Robert A. Taft Information Technology High School, and Gilbert A. Dater High School.
Ownership History
Date
Name
Owned For
Owner Type
Purchase Details
Closed on
Mar 5, 2014
Sold by
Baldwin James D and Baldwin Christina L
Bought by
Mason William L
Current Estimated Value
Home Financials for this Owner
Home Financials are based on the most recent Mortgage that was taken out on this home.
Original Mortgage
$31,350
Outstanding Balance
$23,527
Interest Rate
4.39%
Mortgage Type
New Conventional
Estimated Equity
$67,208
Purchase Details
Closed on
Jul 16, 2010
Sold by
Federal Home Loan Mortgage Corporation
Bought by
Baldwin James D and Baldwin Christina L
Purchase Details
Closed on
Mar 29, 2010
Sold by
Heard Ralph A
Bought by
Federal Home Loan Mortgage Corporation
Purchase Details
Closed on
Aug 3, 2005
Sold by
Summit View Partners Llc
Bought by
Heard Ralph A
Home Financials for this Owner
Home Financials are based on the most recent Mortgage that was taken out on this home.
Original Mortgage
$83,165
Interest Rate
7.75%
Mortgage Type
Fannie Mae Freddie Mac
Create a Home Valuation Report for This Property
The Home Valuation Report is an in-depth analysis detailing your home's value as well as a comparison with similar homes in the area
Home Values in the Area
Average Home Value in this Area
Purchase History
| Date | Buyer | Sale Price | Title Company |
|---|---|---|---|
| Mason William L | $33,000 | Attorney | |
| Baldwin James D | $26,000 | Attorney | |
| Federal Home Loan Mortgage Corporation | $48,000 | None Available | |
| Heard Ralph A | $83,200 | First Title Agency Inc |
Source: Public Records
Mortgage History
| Date | Status | Borrower | Loan Amount |
|---|---|---|---|
| Open | Mason William L | $31,350 | |
| Previous Owner | Heard Ralph A | $83,165 |
Source: Public Records
Tax History
| Year | Tax Paid | Tax Assessment Tax Assessment Total Assessment is a certain percentage of the fair market value that is determined by local assessors to be the total taxable value of land and additions on the property. | Land | Improvement |
|---|---|---|---|---|
| 2025 | $1,354 | $21,963 | $3,500 | $18,463 |
| 2023 | $1,343 | $21,963 | $3,500 | $18,463 |
| 2022 | $797 | $11,659 | $1,400 | $10,259 |
| 2021 | $766 | $11,659 | $1,400 | $10,259 |
| 2020 | $789 | $11,659 | $1,400 | $10,259 |
| 2019 | $755 | $10,224 | $1,400 | $8,824 |
| 2018 | $753 | $10,224 | $1,400 | $8,824 |
| 2017 | $716 | $10,224 | $1,400 | $8,824 |
| 2016 | $820 | $11,550 | $2,310 | $9,240 |
| 2015 | $739 | $11,550 | $2,310 | $9,240 |
| 2014 | $782 | $11,550 | $2,310 | $9,240 |
| 2013 | $627 | $9,100 | $4,200 | $4,900 |
Source: Public Records
About The Residences at Summit View
Map
Nearby Homes
- 1646 State Ave
- 1669 State Ave
- 1671 State Ave
- 2832 Claypole Ave
- 2182 Grand Ave
- 1708 State Ave
- 1114 Wing St
- 1900 State Ave
- 2829 Glenway Ave
- 2540 Ring Place
- 1741 Grand Ave
- 1948 State Ave
- 2500 Warsaw Ave
- 2173 Clara St
- 2169 Clara St
- 2165 Clara St
- 2281 Northside Ave
- 2519 Warsaw Ave
- 2425 Glenway Ave
- 2360 Wilder Ave
- 2701 Lehman Rd Unit A5
- 2701 Lehman Rd Unit A23
- 2701 Lehman Rd Unit A24
- 2701 Lehman Rd Unit A8
- 2701 Lehman Rd Unit A17
- 2701 Lehman Rd Unit A22
- 2701 Lehman Rd Unit A28
- 2701 Lehman Rd Unit A25
- 2701 Lehman Rd Unit A7
- 2701 Lehman Rd Unit A11
- 2701 Lehman Rd Unit A4
- 2701 Lehman Rd Unit A21
- 2701 Lehman Rd
- 2701 Lehman Rd
- 2701 Lehman Rd
- 2701 Lehman Rd
- 2701 Lehman Rd
- 2701 Lehman Rd
- 2701 Lehman Rd
- 2701 Lehman Rd
Your Personal Tour Guide
Ask me questions while you tour the home.