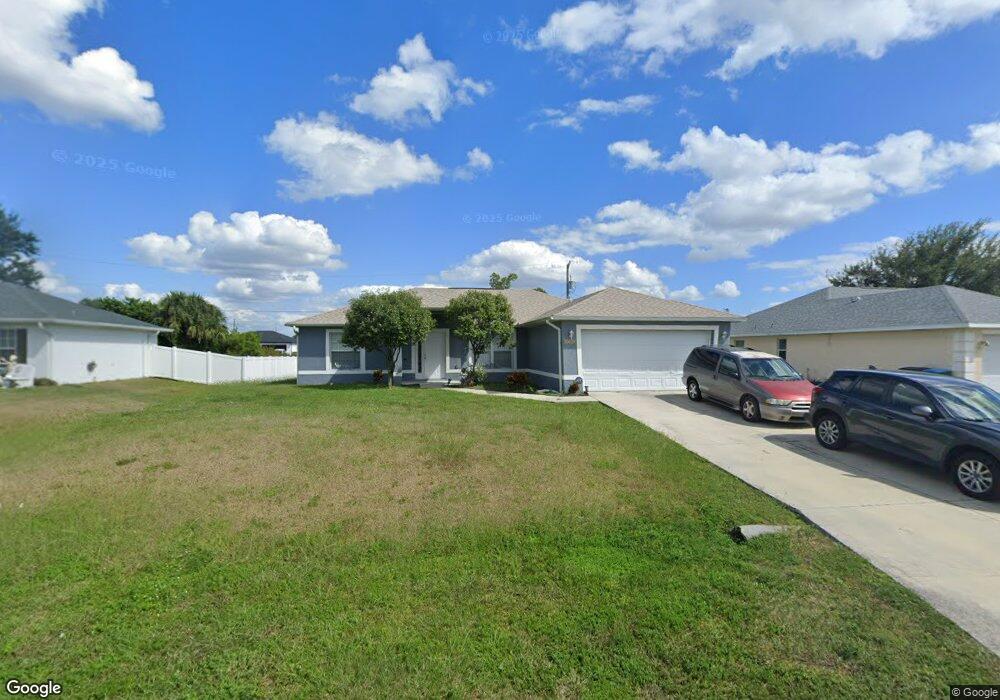
2701 NE 2nd Ave Cape Coral, FL 33909
Mariner NeighborhoodEstimated Value: $227,000 - $315,000
3
Beds
2
Baths
1,570
Sq Ft
$178/Sq Ft
Est. Value
About This Home
This home is located at 2701 NE 2nd Ave, Cape Coral, FL 33909 and is currently estimated at $279,669, approximately $178 per square foot. 2701 NE 2nd Ave is a home located in Lee County with nearby schools including Dr. Carrie D. Robinson Littleton Elementary School, Caloosa Elementary School, and Tropic Isles Elementary School.
Ownership History
Date
Name
Owned For
Owner Type
Purchase Details
Closed on
Aug 12, 2009
Sold by
Moore Jaret W and Watermeier Thomas
Bought by
Nrdb Properties Llc
Current Estimated Value
Purchase Details
Closed on
Mar 30, 2006
Sold by
Arizen Homes Inc
Bought by
Moore Jaret W and Watermeier Thomas
Home Financials for this Owner
Home Financials are based on the most recent Mortgage that was taken out on this home.
Original Mortgage
$247,747
Interest Rate
6.25%
Mortgage Type
Credit Line Revolving
Purchase Details
Closed on
Jun 17, 2004
Sold by
Arnel Donald M and Arnel Beth
Bought by
Arizen Homes Inc
Purchase Details
Closed on
Sep 15, 2003
Sold by
Florida Properties Group Inc
Bought by
Arnel Donald and Arnel Beth
Purchase Details
Closed on
Oct 1, 2002
Sold by
Clerk Circuit Court
Bought by
Freyre Carlos A and Macri David S
Create a Home Valuation Report for This Property
The Home Valuation Report is an in-depth analysis detailing your home's value as well as a comparison with similar homes in the area
Home Values in the Area
Average Home Value in this Area
Purchase History
| Date | Buyer | Sale Price | Title Company |
|---|---|---|---|
| Nrdb Properties Llc | $60,000 | None Available | |
| Moore Jaret W | $275,300 | Guardian Title Services Corp | |
| Arizen Homes Inc | -- | Guardian Title Services Corp | |
| Arnel Donald | $10,500 | -- | |
| Florida Properties Group Inc | -- | -- | |
| Freyre Carlos A | $1,900 | -- |
Source: Public Records
Mortgage History
| Date | Status | Borrower | Loan Amount |
|---|---|---|---|
| Previous Owner | Moore Jaret W | $247,747 |
Source: Public Records
Tax History Compared to Growth
Tax History
| Year | Tax Paid | Tax Assessment Tax Assessment Total Assessment is a certain percentage of the fair market value that is determined by local assessors to be the total taxable value of land and additions on the property. | Land | Improvement |
|---|---|---|---|---|
| 2025 | $4,395 | $214,718 | $34,723 | $179,995 |
| 2024 | $3,991 | $207,650 | -- | -- |
| 2023 | $3,991 | $188,773 | $0 | $0 |
| 2022 | $3,693 | $171,612 | $0 | $0 |
| 2021 | $3,283 | $156,011 | $7,500 | $148,511 |
| 2020 | $3,195 | $146,162 | $7,725 | $138,437 |
| 2019 | $3,084 | $141,318 | $10,000 | $131,318 |
| 2018 | $2,999 | $142,924 | $10,000 | $132,924 |
| 2017 | $2,867 | $137,275 | $6,800 | $130,475 |
| 2016 | $2,617 | $120,610 | $6,800 | $113,810 |
| 2015 | $2,416 | $105,712 | $6,200 | $99,512 |
| 2014 | -- | $99,790 | $5,640 | $94,150 |
| 2013 | -- | $85,199 | $4,200 | $80,999 |
Source: Public Records
Map
Nearby Homes
- 2603 NE 2nd Place
- 2610 NE 1st Place
- 2526 NE 2nd Place
- 2602 NE 1st Place
- 305 NE 27th St
- 2532 NE 1st Place
- 2703 NE 1st Ave
- 2720 NE 1st Place
- 2521 NE 1st Place
- 2730 NE 2nd Place
- 108 NE 27th Terrace
- 204 NE 25th Terrace
- 2737 NE 2nd Place
- 322 NE 27th St
- 37 NE 27th Terrace
- 329 NE 27th St Unit 36
- 318 NE 25th Terrace
- 303 NE 25th St
- 2804 NE 3rd Ave
- 315 NE 25th St
- 2705 NE 2nd Ave
- 2621 NE 2nd Ave
- 2700 NE 2nd Place
- 2622 NE 2nd Place
- 2617 NE 2nd Ave
- 2700 NE 2nd Ave
- 2704 NE 2nd Ave
- 2622 NE 2nd Ave
- 2708 NE 2nd Ave
- 2613 NE 2nd Ave
- 2614 NE 2nd Place
- 2712 NE 2nd Place
- 2701 NE 2nd Place
- 2701 NE 1st Place
- 2614 NE 2nd Ave Unit 36
- 2621 NE 1st Place
- 2609 NE 2nd Ave
- 2717 NE 2nd Ave
- 2617 NE 2nd Place
- 2709 NE 1st Place