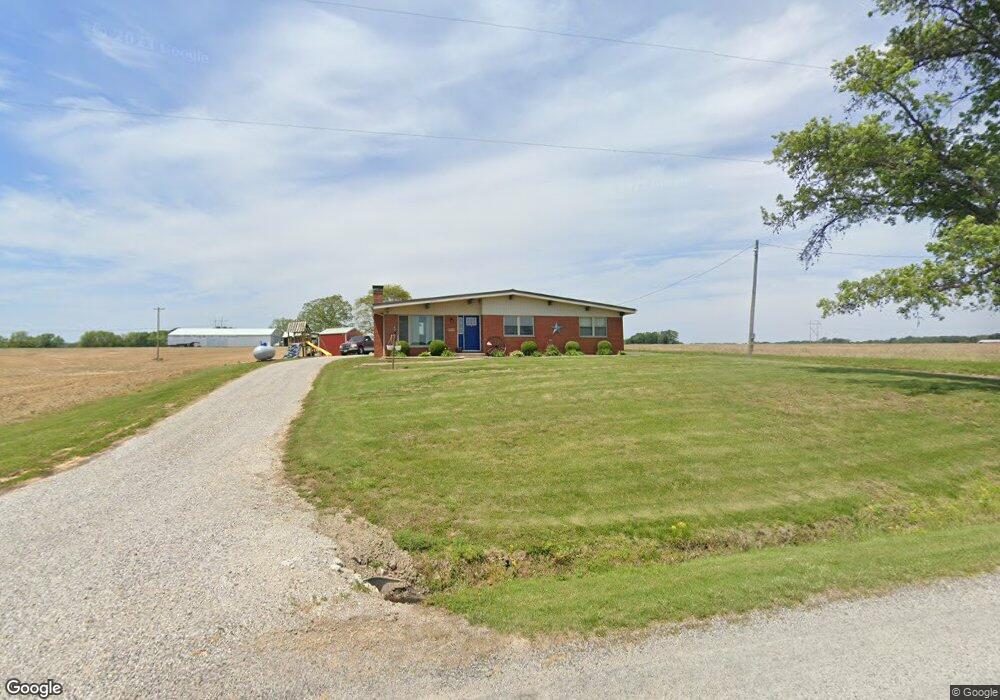
2701 Park Rd Belleville, IL 62220
Estimated Value: $170,000 - $248,000
--
Bed
--
Bath
1,276
Sq Ft
$156/Sq Ft
Est. Value
About This Home
This home is located at 2701 Park Rd, Belleville, IL 62220 and is currently estimated at $198,484, approximately $155 per square foot. 2701 Park Rd is a home located in St. Clair County with nearby schools including Westhaven Elementary School, Central Jr High School, and Governor French Academy.
Ownership History
Date
Name
Owned For
Owner Type
Purchase Details
Closed on
Dec 20, 2024
Sold by
Parker Ryan Jeffrey and Parker Laura Kay
Bought by
Parker Ryan Jeffrey
Current Estimated Value
Home Financials for this Owner
Home Financials are based on the most recent Mortgage that was taken out on this home.
Original Mortgage
$25,000
Outstanding Balance
$24,805
Interest Rate
6.84%
Mortgage Type
New Conventional
Estimated Equity
$173,679
Purchase Details
Closed on
Dec 28, 2020
Sold by
Parker Virginia L and Virgil E Parker Trust
Bought by
Parker Ryan Jeffrey and Parker Laura Kay
Home Financials for this Owner
Home Financials are based on the most recent Mortgage that was taken out on this home.
Original Mortgage
$110,000
Interest Rate
2.7%
Mortgage Type
Commercial
Purchase Details
Closed on
May 16, 2013
Sold by
Parker Virginia L
Bought by
Parker Virginia L and Virgil E Parker Trust
Purchase Details
Closed on
May 19, 2004
Sold by
Parker Virginia Lee
Bought by
Parker Virginia Lee and Parker Virgil E
Create a Home Valuation Report for This Property
The Home Valuation Report is an in-depth analysis detailing your home's value as well as a comparison with similar homes in the area
Home Values in the Area
Average Home Value in this Area
Purchase History
| Date | Buyer | Sale Price | Title Company |
|---|---|---|---|
| Parker Ryan Jeffrey | -- | Town & Country Title | |
| Parker Ryan Jeffrey | $150,000 | First American | |
| Parker Virginia L | -- | None Available | |
| Parker Virginia Lee | -- | -- |
Source: Public Records
Mortgage History
| Date | Status | Borrower | Loan Amount |
|---|---|---|---|
| Open | Parker Ryan Jeffrey | $25,000 | |
| Previous Owner | Parker Ryan Jeffrey | $110,000 |
Source: Public Records
Tax History Compared to Growth
Tax History
| Year | Tax Paid | Tax Assessment Tax Assessment Total Assessment is a certain percentage of the fair market value that is determined by local assessors to be the total taxable value of land and additions on the property. | Land | Improvement |
|---|---|---|---|---|
| 2024 | $3,173 | $49,738 | $4,098 | $45,640 |
| 2023 | $3,097 | $46,279 | $3,705 | $42,574 |
| 2022 | $2,888 | $42,565 | $3,313 | $39,252 |
| 2021 | $2,773 | $40,101 | $3,013 | $37,088 |
| 2020 | $3,003 | $35,248 | $2,841 | $32,407 |
| 2019 | $2,903 | $35,101 | $2,694 | $32,407 |
| 2018 | $2,841 | $33,838 | $2,485 | $31,353 |
| 2017 | $2,740 | $32,276 | $2,268 | $30,008 |
| 2016 | $2,854 | $32,049 | $2,191 | $29,858 |
| 2014 | $2,477 | $31,455 | $2,028 | $29,427 |
| 2013 | $2,102 | $32,073 | $2,067 | $30,006 |
Source: Public Records
Map
Nearby Homes
- 178 Wyndrose Estates Dr
- 7168 Mine Haul Rd
- 324 Lake Forest Dr
- 6264 Roachtown Rd
- 800 Springwood Dr
- 245 Summers Trace
- 1824 Menard Dr
- 1909 Menard Dr
- 4900 Barnwood Ln
- 633 Springwood Dr
- 4904 Barnwood Ln
- 6409 Balsam Ridge
- 45 Fenwood Dr
- 6009 Rolling Hills Ln
- 401 Pecan Ln
- 33 Forest Gate Dr
- 1500 State Street Rd
- 1374 Rocky Creek Ct
- 1366 Radden Ct
- 334 Spring Lake Rd
- 640 Hoffmann Ln
- 5201 Triple Oaks Ln
- 5219 Triple Oaks Ln
- 2507 Park Rd
- 2529 Park Rd
- 608 Hoffmann Ln
- 504 Bluebird Ln
- 171 Wyndrose Estates Dr
- 732 Bluebird Ln
- 517 Hoffmann Ln
- 2516 Park Rd
- 167 Wyndrose Estates Dr
- 500 Hoffmann Ln
- 216 Wyndrose Estates Ct
- 163 Wyndrose Estates Dr
- 2616 Park Rd
- 172 Wyndrose Estates Dr
- 159 Wyndrose Estates Dr
- 168 Wyndrose Estates Dr
- 162 Wyndrose Estates Dr