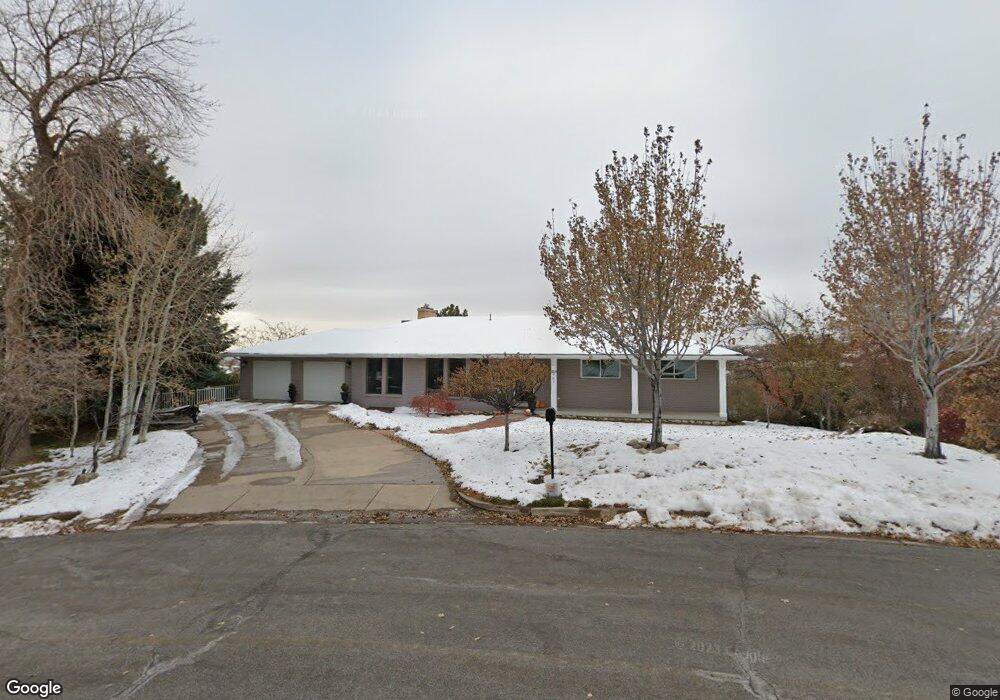
2701 Sky View Dr Layton, UT 84040
Estimated Value: $733,000 - $979,000
6
Beds
3
Baths
5,309
Sq Ft
$150/Sq Ft
Est. Value
About This Home
This home is located at 2701 Sky View Dr, Layton, UT 84040 and is currently estimated at $796,910, approximately $150 per square foot. 2701 Sky View Dr is a home located in Davis County with nearby schools including Sarah Jane Adams Elementary School, North Layton Junior High School, and Northridge High School.
Ownership History
Date
Name
Owned For
Owner Type
Purchase Details
Closed on
Sep 16, 2022
Sold by
Seblaser Llc
Bought by
Graham Stanford J and Strong Jorden C
Current Estimated Value
Home Financials for this Owner
Home Financials are based on the most recent Mortgage that was taken out on this home.
Original Mortgage
$582,200
Outstanding Balance
$567,452
Interest Rate
5.13%
Mortgage Type
New Conventional
Estimated Equity
$229,458
Purchase Details
Closed on
Mar 19, 2013
Sold by
Crow Vii Andrew G
Bought by
Crow Vii Andrew G and Crow Amie Sue
Purchase Details
Closed on
Jun 22, 2007
Sold by
Freeman Frankie H and Lynn Hansen E
Bought by
Crow Vii Andrew G
Home Financials for this Owner
Home Financials are based on the most recent Mortgage that was taken out on this home.
Original Mortgage
$256,800
Interest Rate
9.6%
Mortgage Type
Purchase Money Mortgage
Purchase Details
Closed on
Sep 18, 1996
Sold by
Hansen Ethen L and Hansen Wanda A
Bought by
Hansen Ethen L and Hansen Wanda A
Create a Home Valuation Report for This Property
The Home Valuation Report is an in-depth analysis detailing your home's value as well as a comparison with similar homes in the area
Home Values in the Area
Average Home Value in this Area
Purchase History
| Date | Buyer | Sale Price | Title Company |
|---|---|---|---|
| Graham Stanford J | -- | Cottonwood Title | |
| Crow Vii Andrew G | -- | Mountain America Title Makes | |
| Crow Vii Andrew G | -- | Founders Title Co Layton | |
| Hansen Ethen L | -- | -- |
Source: Public Records
Mortgage History
| Date | Status | Borrower | Loan Amount |
|---|---|---|---|
| Open | Graham Stanford J | $582,200 | |
| Previous Owner | Crow Vii Andrew G | $256,800 |
Source: Public Records
Tax History
| Year | Tax Paid | Tax Assessment Tax Assessment Total Assessment is a certain percentage of the fair market value that is determined by local assessors to be the total taxable value of land and additions on the property. | Land | Improvement |
|---|---|---|---|---|
| 2025 | $3,968 | $386,650 | $124,412 | $262,238 |
| 2024 | $3,940 | $390,500 | $137,807 | $252,693 |
| 2023 | $3,968 | $700,000 | $175,584 | $524,416 |
| 2022 | $3,726 | $649,000 | $172,838 | $476,162 |
| 2021 | $3,355 | $478,000 | $194,786 | $283,214 |
| 2020 | $3,044 | $415,000 | $165,437 | $249,563 |
| 2019 | $2,987 | $401,000 | $146,089 | $254,911 |
| 2018 | $2,768 | $373,000 | $119,947 | $253,053 |
| 2016 | $2,411 | $169,950 | $61,812 | $108,138 |
| 2015 | $2,493 | $168,190 | $61,812 | $106,378 |
| 2014 | $2,267 | $157,068 | $61,812 | $95,256 |
| 2013 | -- | $164,759 | $40,109 | $124,650 |
Source: Public Records
Map
Nearby Homes
- 2563 E 2250 N
- 2136 N 2800 E
- 1954 N 2600 E
- 2569 N 2900 E
- 2547 E 1900 N
- 2509 E 1900 N
- 2597 N 2300 E
- 1907 N Bridge Ct
- 2391 Kays Creek Dr
- 1960 N 2150 E
- 2340 N 2050 E
- 2273 N 1975 E
- 2353 Canyon View Dr
- 1752 N Valley View Dr
- 2231 N Valley View Dr
- 1870 N Valley View Dr Unit 201
- 2189 N 1950 E
- 1935 Deere Valley Dr
- 1332 N 2350 E
- 1911 Deere Valley Dr
- 2697 Sky View Dr
- 2709 Sky View Dr
- 2708 Sky View Dr
- 2252 N 2650 E
- 2719 Sky View Dr
- 2661 E 2250 N
- 2661 E 2250 N Unit 1
- 2744 Sky View Dr
- 2563 E 2250 N Unit 194
- 2556 E 2250 N
- 2683 E 2250 N
- 2683 E 2250 N Unit 2
- 2782 Sky View Dr
- 2248 N 2650 E
- 2264 N 2650 E
- 2551 E 2250 N
- 2731 Sky View Dr
- 2713 E 2250 N
- 2713 E 2250 N Unit 3
- 2300 Cheryle Way
Your Personal Tour Guide
Ask me questions while you tour the home.