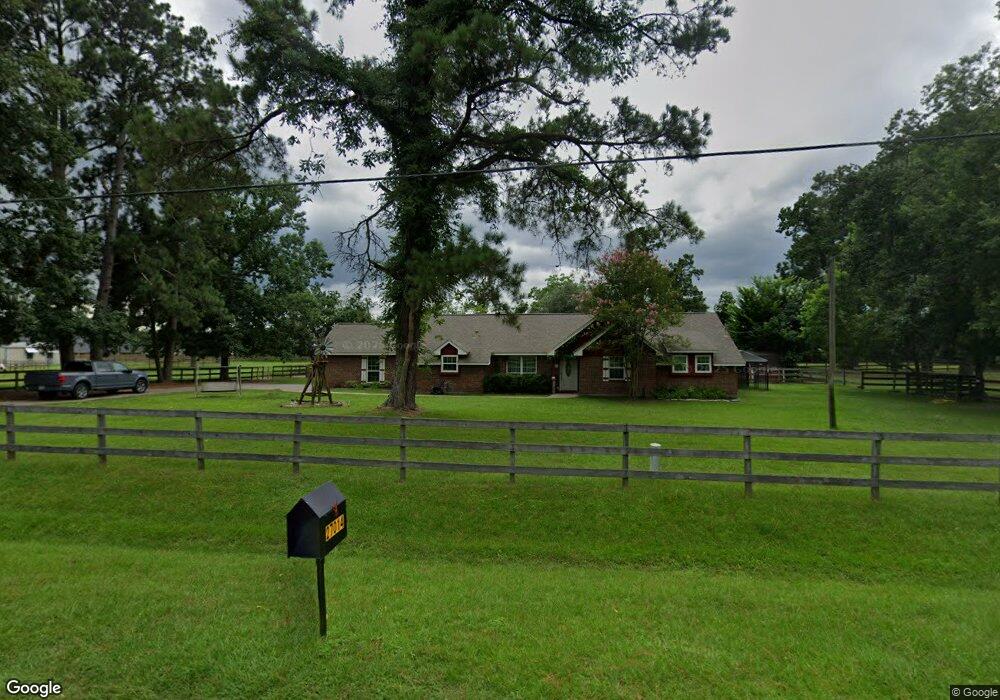
27011 S Creek Dr Magnolia, TX 77354
Estimated Value: $289,000 - $603,000
4
Beds
2
Baths
1,991
Sq Ft
$213/Sq Ft
Est. Value
About This Home
This home is located at 27011 S Creek Dr, Magnolia, TX 77354 and is currently estimated at $423,815, approximately $212 per square foot. 27011 S Creek Dr is a home located in Montgomery County with nearby schools including Cedric C Smith, Bear Branch Junior High School, and Magnolia High School.
Ownership History
Date
Name
Owned For
Owner Type
Purchase Details
Closed on
Sep 25, 2014
Sold by
Banky Michael J
Bought by
Banky Christine E
Current Estimated Value
Home Financials for this Owner
Home Financials are based on the most recent Mortgage that was taken out on this home.
Original Mortgage
$148,000
Outstanding Balance
$113,547
Interest Rate
4.12%
Mortgage Type
Assumption
Estimated Equity
$310,268
Purchase Details
Closed on
Nov 29, 2005
Sold by
Phillips Eric E and Phillips Susan M
Bought by
Banky Michael J
Home Financials for this Owner
Home Financials are based on the most recent Mortgage that was taken out on this home.
Original Mortgage
$37,000
Interest Rate
6.29%
Mortgage Type
Unknown
Purchase Details
Closed on
Dec 4, 1990
Sold by
Levitz F P
Bought by
Banky Christine E
Create a Home Valuation Report for This Property
The Home Valuation Report is an in-depth analysis detailing your home's value as well as a comparison with similar homes in the area
Home Values in the Area
Average Home Value in this Area
Purchase History
| Date | Buyer | Sale Price | Title Company |
|---|---|---|---|
| Banky Christine E | -- | None Available | |
| Banky Michael J | -- | Alamo Title Company | |
| Banky Christine E | -- | -- |
Source: Public Records
Mortgage History
| Date | Status | Borrower | Loan Amount |
|---|---|---|---|
| Open | Banky Christine E | $148,000 | |
| Closed | Banky Michael J | $37,000 | |
| Closed | Banky Michael J | $148,000 |
Source: Public Records
Tax History Compared to Growth
Tax History
| Year | Tax Paid | Tax Assessment Tax Assessment Total Assessment is a certain percentage of the fair market value that is determined by local assessors to be the total taxable value of land and additions on the property. | Land | Improvement |
|---|---|---|---|---|
| 2025 | $2,063 | $223,354 | -- | -- |
| 2024 | $1,780 | $203,049 | -- | -- |
| 2023 | $1,780 | $184,590 | $77,630 | $153,220 |
| 2022 | $3,729 | $211,300 | $77,630 | $133,670 |
| 2021 | $2,881 | $155,010 | $36,790 | $118,220 |
| 2020 | $2,806 | $138,680 | $36,790 | $101,890 |
| 2019 | $3,255 | $161,630 | $36,790 | $124,840 |
| 2018 | $2,867 | $135,620 | $36,790 | $98,830 |
| 2017 | $2,876 | $135,620 | $36,790 | $98,830 |
| 2016 | $2,865 | $135,100 | $36,790 | $98,310 |
| 2015 | $1,868 | $127,470 | $5,790 | $121,680 |
| 2014 | $1,868 | $97,060 | $5,790 | $91,270 |
Source: Public Records
Map
Nearby Homes
- 27146 Grey Fox Run
- 10017 Ocelot Ct
- 27076 Badger Way
- 27165 Kestrel Trail
- 10010 Cottontail Ct
- 27097 Kestrel Trail
- 27274 Axis Deer Trail
- 27307 N Creek Dr
- 27278 Axis Deer Trail
- 27286 Axis Deer Trail
- 27310 Axis Deer Trail
- 27314 Axis Deer Trail
- 27318 Axis Deer Trail
- 27110 Cherokee Ln
- 10216 Longhorn Ridge Ct
- 10131 Red Snapper Rd
- 10155 Red Snapper Rd
- The Oriole II Plan at Mill Creek Trails - 40's
- The Mockingbird II Plan at Mill Creek Trails - 40's
- The Blue Jay II Plan at Mill Creek Trails - 40's
- 27158 Grey Fox Run
- 27162 Grey Fox Run
- 27166 Grey Fox Run
- 27103 S Creek Dr
- 27109 S Creek Dr
- 27142 Grey Fox Run
- 27154 Grey Fox Run
- 27150 Grey Fox Run
- 27170 Grey Fox Run
- 27134 Grey Fox Run
- 27102 S Creek Dr
- 27138 Grey Fox Run
- 27174 Grey Fox Run
- 27178 Grey Fox Run
- 10004 Gold Finch Run
- 27130 Grey Fox Run
- 27182 Grey Fox Run
- 27014 S Creek Dr
- 27151 Grey Fox Run
- 27126 Grey Fox Run