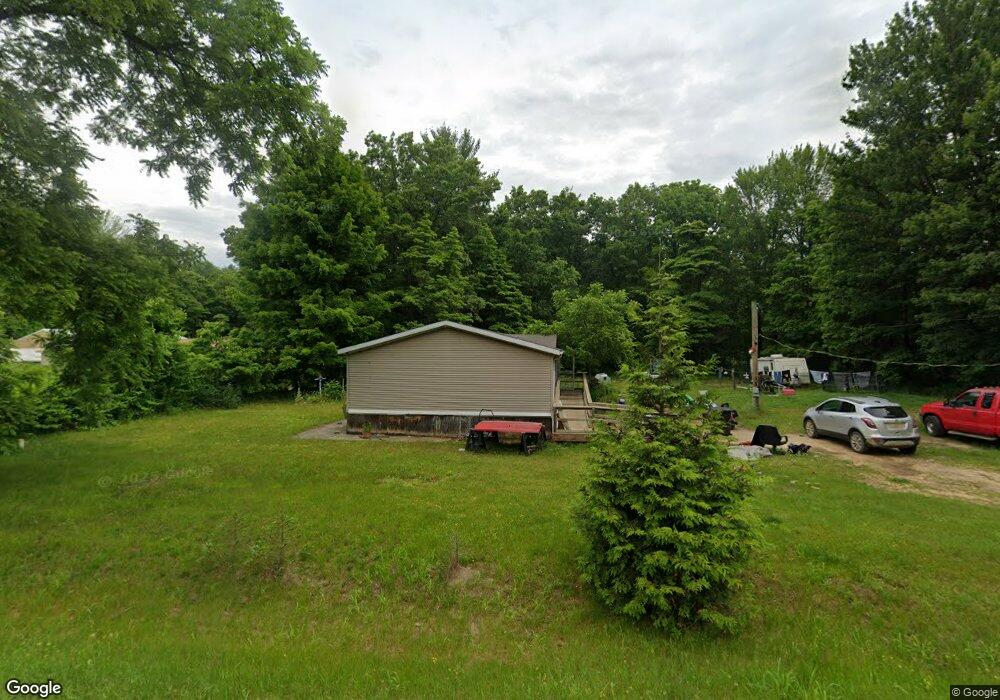
2703 113th Ave Allegan, MI 49010
Estimated Value: $206,000 - $219,350
3
Beds
2
Baths
1,960
Sq Ft
$110/Sq Ft
Est. Value
About This Home
This home is located at 2703 113th Ave, Allegan, MI 49010 and is currently estimated at $215,838, approximately $110 per square foot. 2703 113th Ave is a home located in Allegan County with nearby schools including Pine Trails Elementary School, L.E. White Middle School, and Allegan High School.
Ownership History
Date
Name
Owned For
Owner Type
Purchase Details
Closed on
Mar 21, 2008
Sold by
Green Tree Servicing Llc
Bought by
Major Richard G
Current Estimated Value
Home Financials for this Owner
Home Financials are based on the most recent Mortgage that was taken out on this home.
Original Mortgage
$62,500
Outstanding Balance
$39,662
Interest Rate
6.09%
Mortgage Type
FHA
Estimated Equity
$176,176
Purchase Details
Closed on
Dec 4, 2000
Bought by
Delafuente Ernes and Delafuente Robin
Purchase Details
Closed on
Nov 30, 2000
Sold by
Jennings Darl R
Bought by
Lsrd Ltd
Create a Home Valuation Report for This Property
The Home Valuation Report is an in-depth analysis detailing your home's value as well as a comparison with similar homes in the area
Home Values in the Area
Average Home Value in this Area
Purchase History
| Date | Buyer | Sale Price | Title Company |
|---|---|---|---|
| Major Richard G | $63,000 | None Available | |
| Delafuente Ernes | $14,000 | -- | |
| Lsrd Ltd | -- | -- |
Source: Public Records
Mortgage History
| Date | Status | Borrower | Loan Amount |
|---|---|---|---|
| Open | Major Richard G | $62,500 |
Source: Public Records
Tax History Compared to Growth
Tax History
| Year | Tax Paid | Tax Assessment Tax Assessment Total Assessment is a certain percentage of the fair market value that is determined by local assessors to be the total taxable value of land and additions on the property. | Land | Improvement |
|---|---|---|---|---|
| 2025 | $1,205 | $56,300 | $29,000 | $27,300 |
| 2024 | $1,098 | $55,600 | $29,000 | $26,600 |
| 2023 | $1,098 | $46,300 | $23,000 | $23,300 |
| 2022 | $1,098 | $42,700 | $22,000 | $20,700 |
| 2021 | $1,013 | $38,700 | $21,300 | $17,400 |
| 2020 | $1,013 | $34,300 | $18,000 | $16,300 |
| 2019 | $0 | $31,900 | $16,200 | $15,700 |
| 2018 | $0 | $32,800 | $17,000 | $15,800 |
| 2017 | $0 | $30,900 | $16,900 | $14,000 |
| 2016 | $0 | $29,100 | $16,500 | $12,600 |
| 2015 | -- | $29,100 | $16,500 | $12,600 |
| 2014 | -- | $27,600 | $16,000 | $11,600 |
| 2013 | -- | $31,200 | $17,500 | $13,700 |
Source: Public Records
Map
Nearby Homes