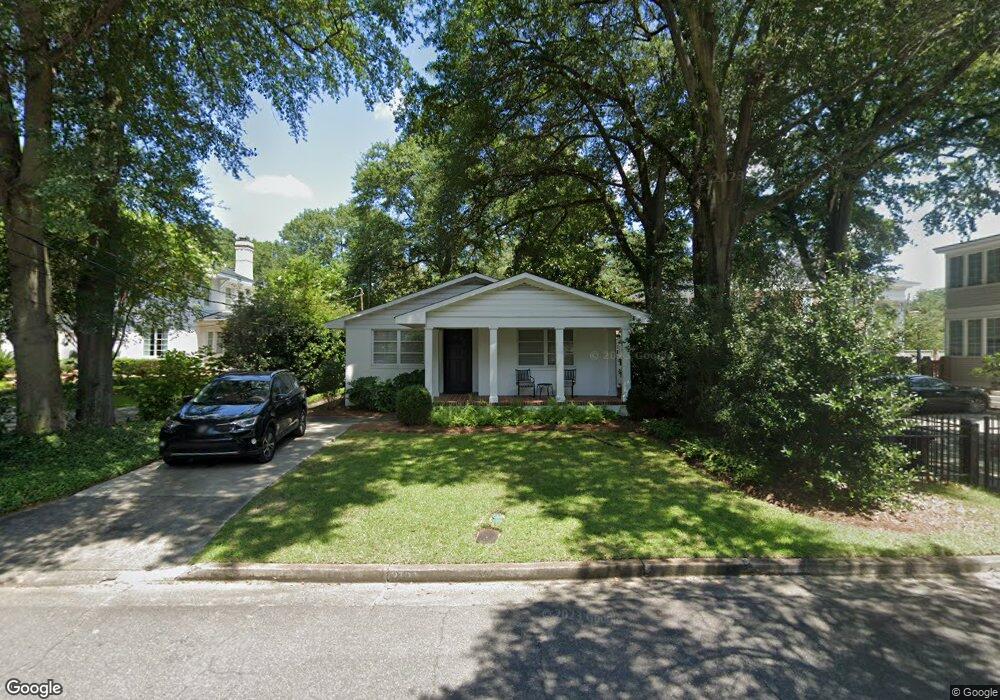
2703 Bellevue Ave Augusta, GA 30909
Forest Hills NeighborhoodEstimated Value: $167,324 - $315,000
2
Beds
2
Baths
1,078
Sq Ft
$214/Sq Ft
Est. Value
About This Home
This home is located at 2703 Bellevue Ave, Augusta, GA 30909 and is currently estimated at $230,331, approximately $213 per square foot. 2703 Bellevue Ave is a home located in Richmond County with nearby schools including Lake Forest Hills Elementary School, Tutt Middle School, and Johnson Magnet.
Ownership History
Date
Name
Owned For
Owner Type
Purchase Details
Closed on
Jul 28, 2017
Sold by
Robertson George W
Bought by
Boardman Catherine B
Current Estimated Value
Purchase Details
Closed on
Apr 22, 2008
Sold by
Stafford Frank Alvis
Bought by
Robertson George W and Robertson Jacqueline S
Home Financials for this Owner
Home Financials are based on the most recent Mortgage that was taken out on this home.
Original Mortgage
$305,000
Interest Rate
6.08%
Mortgage Type
Purchase Money Mortgage
Purchase Details
Closed on
Feb 22, 2006
Sold by
Stafford Jill F
Bought by
Stafford Frank Alvis
Purchase Details
Closed on
Mar 22, 1999
Sold by
Thomas Luther M
Bought by
Stafford Jill F
Home Financials for this Owner
Home Financials are based on the most recent Mortgage that was taken out on this home.
Original Mortgage
$52,000
Interest Rate
6.37%
Mortgage Type
Purchase Money Mortgage
Purchase Details
Closed on
Dec 1, 1974
Create a Home Valuation Report for This Property
The Home Valuation Report is an in-depth analysis detailing your home's value as well as a comparison with similar homes in the area
Home Values in the Area
Average Home Value in this Area
Purchase History
| Date | Buyer | Sale Price | Title Company |
|---|---|---|---|
| Boardman Catherine B | $145,000 | -- | |
| Robertson George W | $415,000 | None Available | |
| Stafford Frank Alvis | -- | None Available | |
| Stafford Jill F | $65,000 | -- | |
| -- | $20,300 | -- |
Source: Public Records
Mortgage History
| Date | Status | Borrower | Loan Amount |
|---|---|---|---|
| Previous Owner | Robertson George W | $305,000 | |
| Previous Owner | Stafford Jill F | $52,000 |
Source: Public Records
Tax History
| Year | Tax Paid | Tax Assessment Tax Assessment Total Assessment is a certain percentage of the fair market value that is determined by local assessors to be the total taxable value of land and additions on the property. | Land | Improvement |
|---|---|---|---|---|
| 2025 | $2,288 | $65,828 | $12,940 | $52,888 |
| 2024 | $2,288 | $73,180 | $12,940 | $60,240 |
| 2023 | $2,432 | $64,592 | $12,940 | $51,652 |
| 2022 | $1,676 | $44,639 | $12,940 | $31,699 |
| 2021 | $1,714 | $41,775 | $12,940 | $28,835 |
| 2020 | $1,574 | $38,247 | $6,599 | $31,648 |
| 2019 | $1,665 | $38,247 | $6,599 | $31,648 |
| 2018 | $1,640 | $37,197 | $6,599 | $30,598 |
| 2017 | $1,447 | $31,978 | $6,599 | $25,379 |
| 2016 | $1,447 | $31,978 | $6,599 | $25,379 |
| 2015 | $1,455 | $31,978 | $6,599 | $25,379 |
| 2014 | $1,457 | $31,978 | $6,599 | $25,379 |
Source: Public Records
Map
Nearby Homes
- 1231 Glenn Ave
- 2602 Walton Way
- 1323 Glenn Ave
- 1015 Monte Sano Ave
- 1210 Peachtree Rd
- 2844 Lombardy Ct
- 2904 Lombardy Ct
- 801 Monte Sano Ave Unit B1
- 801 Monte Sano Ave Unit C4
- 1436 Glenn Ave
- 2716 Hazel St
- 2875 Lake Forest Dr
- 3348 Walton Way
- 2551 Mount Auburn St
- 2644 Raymond Ave
- 2632 Raymond Ave
- 2533 Wheeler Rd
- 2816 Royal St
- 2541 Wheeler Rd
- 2409 Central Ave
- 2705 Bellevue Ave
- 1131 Highland Ave
- 1125 Highland Ave
- 2709 Bellevue Ave
- 2706 Bellevue Ave
- 1119 Highland Ave
- 1205 Highland Ave
- 2708 Bellevue Ave
- 2706 Hillcrest Ave
- 2708 Hillcrest Ave
- 2711 Bellevue Ave
- 2710 Hillcrest Ave
- 1130 Highland Ave
- 2710 Bellevue Ave
- 1202 Highland Ave
- 1126 Highland Ave
- 1207 Highland Ave
- 1122 Highland Ave
- 1204 Highland Ave
- 2712 Hillcrest Ave
Your Personal Tour Guide
Ask me questions while you tour the home.