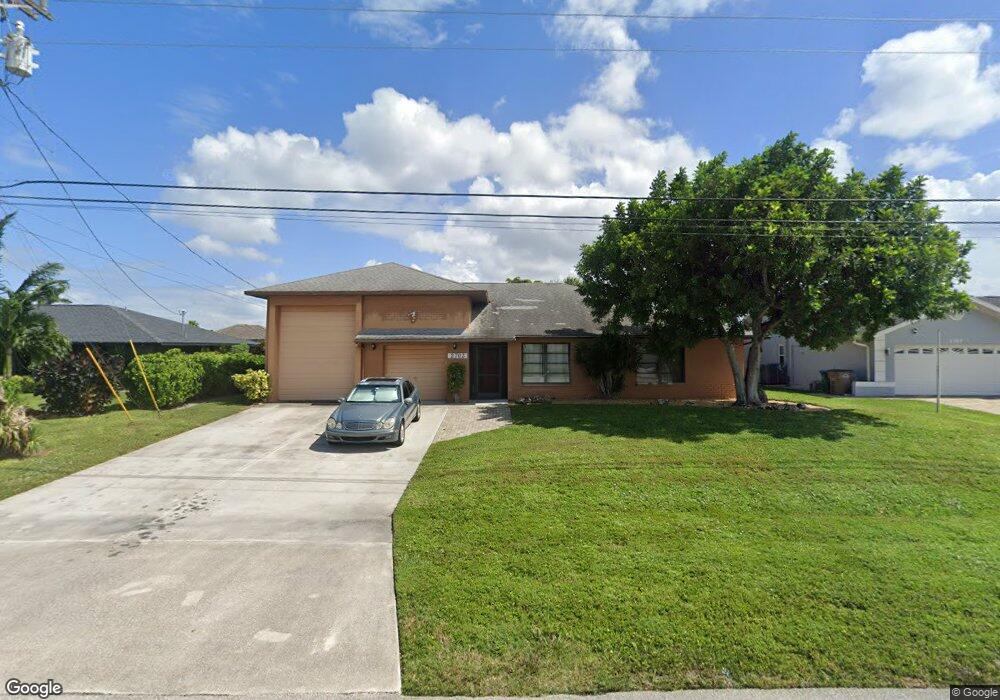
2703 E Archer Pkwy Unit 21 Cape Coral, FL 33904
Caloosahatchee NeighborhoodEstimated Value: $369,509 - $511,000
2
Beds
2
Baths
1,930
Sq Ft
$230/Sq Ft
Est. Value
About This Home
This home is located at 2703 E Archer Pkwy Unit 21, Cape Coral, FL 33904 and is currently estimated at $443,877, approximately $229 per square foot. 2703 E Archer Pkwy Unit 21 is a home located in Lee County with nearby schools including Cape Elementary School, Caloosa Elementary School, and Tropic Isles Elementary School.
Ownership History
Date
Name
Owned For
Owner Type
Purchase Details
Closed on
Nov 24, 2010
Sold by
Ingargiola Anthony
Bought by
Equity Trust and Sterling Trust
Current Estimated Value
Purchase Details
Closed on
Nov 23, 2001
Sold by
Thibeault Lucien R and Thibeault Rita
Bought by
Ingargiola Anthony J
Home Financials for this Owner
Home Financials are based on the most recent Mortgage that was taken out on this home.
Original Mortgage
$50,000
Interest Rate
6.59%
Purchase Details
Closed on
Dec 15, 2000
Sold by
Artz Robert E and Artz Joan M
Bought by
Thibeault Lucien R and Thibeault Rita M
Purchase Details
Closed on
Nov 16, 1993
Sold by
Langbein Bert and Langbein Erma D
Bought by
Artz Robert E and Artz Joan M
Home Financials for this Owner
Home Financials are based on the most recent Mortgage that was taken out on this home.
Original Mortgage
$75,000
Interest Rate
6.95%
Create a Home Valuation Report for This Property
The Home Valuation Report is an in-depth analysis detailing your home's value as well as a comparison with similar homes in the area
Home Values in the Area
Average Home Value in this Area
Purchase History
| Date | Buyer | Sale Price | Title Company |
|---|---|---|---|
| Equity Trust | $162,500 | Paradise Professional Title | |
| Ingargiola Anthony J | $180,000 | -- | |
| Thibeault Lucien R | $160,000 | -- | |
| Artz Robert E | $143,000 | -- |
Source: Public Records
Mortgage History
| Date | Status | Borrower | Loan Amount |
|---|---|---|---|
| Previous Owner | Ingargiola Anthony J | $50,000 | |
| Previous Owner | Artz Robert E | $75,000 |
Source: Public Records
Tax History Compared to Growth
Tax History
| Year | Tax Paid | Tax Assessment Tax Assessment Total Assessment is a certain percentage of the fair market value that is determined by local assessors to be the total taxable value of land and additions on the property. | Land | Improvement |
|---|---|---|---|---|
| 2025 | $6,030 | $328,414 | $284,240 | $40,433 |
| 2024 | $6,755 | $331,347 | $186,326 | $132,095 |
| 2023 | $6,755 | $336,064 | $0 | $0 |
| 2022 | $6,081 | $305,513 | $0 | $0 |
| 2021 | $5,388 | $277,739 | $118,209 | $159,530 |
| 2020 | $5,122 | $252,743 | $94,000 | $158,743 |
| 2019 | $5,033 | $249,524 | $114,400 | $135,124 |
| 2018 | $4,791 | $230,945 | $109,000 | $121,945 |
| 2017 | $4,985 | $236,612 | $96,500 | $140,112 |
| 2016 | $4,814 | $235,636 | $105,636 | $130,000 |
| 2015 | $4,548 | $220,396 | $86,614 | $133,782 |
| 2014 | $4,216 | $182,303 | $80,105 | $102,198 |
| 2013 | -- | $177,488 | $67,497 | $109,991 |
Source: Public Records
Map
Nearby Homes
- 2717 Shelby Pkwy
- 2614 SE 12th Place
- 1207 SE 27th Terrace
- 1216 SE 27th St
- 2540 Shelby Pkwy
- 1220 SE 27th St
- 2532 Shelby Pkwy
- 1313 Shelby Pkwy
- 1015 SE 25th Ln
- 2916 SE 11th Ave
- 1008 SE 25th Terrace
- 1219 SE 25th Terrace
- 1312 SE 25th Ln
- 1120 SE 29th Terrace
- 2941 SE 10th Place
- 2807 Country Club Blvd
- 1227 Everest Pkwy
- 1414 Shelby Pkwy
- 1120 SE 30th St
- 1419 Shelby Pkwy
- 2621 Archer Pkwy E
- 2621 E Archer Pkwy
- 2707 E Archer Pkwy
- 2711 E Archer Pkwy
- 2617 E Archer Pkwy
- 2617 Archer Pkwy E
- 2704 E Archer Pkwy
- 2613 E Archer Pkwy
- 1037 SE 27th St
- 2710 Shelby Pkwy
- 1031 SE 27th Terrace
- 2716 Shelby Pkwy
- 2706 Shelby Pkwy
- 2719 E Archer Pkwy
- 2609 E Archer Pkwy
- 1042 SE 26th Terrace
- 2729 E Archer Pkwy
- 1031 SE 27th St
- 2618 Shelby Pkwy
- 1028 SE 27th St