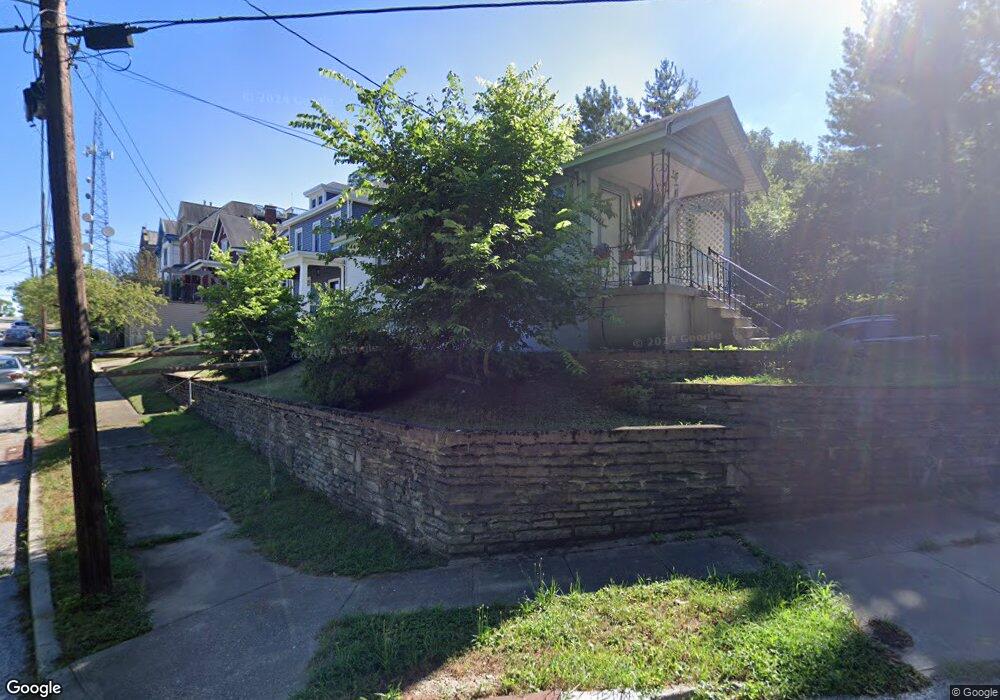
2703 Maryland Ave Cincinnati, OH 45204
East Price Hill NeighborhoodEstimated Value: $121,000 - $148,000
2
Beds
1
Bath
864
Sq Ft
$159/Sq Ft
Est. Value
About This Home
This home is located at 2703 Maryland Ave, Cincinnati, OH 45204 and is currently estimated at $137,712, approximately $159 per square foot. 2703 Maryland Ave is a home located in Hamilton County with nearby schools including Robert A. Taft Information Technology High School, Gilbert A. Dater High School, and Western Hills High School.
Ownership History
Date
Name
Owned For
Owner Type
Purchase Details
Closed on
Aug 27, 2015
Sold by
Gsb Properties Inc
Bought by
Vinebrook Annex B Ohio Llc
Current Estimated Value
Purchase Details
Closed on
Jun 23, 2015
Sold by
Overbeck David J and Overbeck Karen
Bought by
Gsb Properties Inc
Purchase Details
Closed on
Apr 10, 2008
Sold by
Campbell Nernie and Campbell Lorie A
Bought by
Franklin Credit Management Corp
Purchase Details
Closed on
Apr 4, 2008
Sold by
Franklin Credit Management Corp
Bought by
Overbeck David J
Purchase Details
Closed on
Dec 2, 1999
Sold by
Henderson Donald
Bought by
Campbell Nernie R and Campbell Lorie A
Home Financials for this Owner
Home Financials are based on the most recent Mortgage that was taken out on this home.
Original Mortgage
$55,000
Interest Rate
7.87%
Mortgage Type
Balloon
Purchase Details
Closed on
Nov 20, 1995
Sold by
Henderson Donald and Henderson Mary
Bought by
Henderson Sherman R
Create a Home Valuation Report for This Property
The Home Valuation Report is an in-depth analysis detailing your home's value as well as a comparison with similar homes in the area
Home Values in the Area
Average Home Value in this Area
Purchase History
| Date | Buyer | Sale Price | Title Company |
|---|---|---|---|
| Vinebrook Annex B Ohio Llc | -- | Attorney | |
| Gsb Properties Inc | -- | Attorney | |
| Franklin Credit Management Corp | $46,000 | None Available | |
| Overbeck David J | $36,675 | Attorney | |
| Campbell Nernie R | $55,000 | -- | |
| Henderson Sherman R | -- | -- |
Source: Public Records
Mortgage History
| Date | Status | Borrower | Loan Amount |
|---|---|---|---|
| Previous Owner | Campbell Nernie R | $55,000 |
Source: Public Records
Tax History Compared to Growth
Tax History
| Year | Tax Paid | Tax Assessment Tax Assessment Total Assessment is a certain percentage of the fair market value that is determined by local assessors to be the total taxable value of land and additions on the property. | Land | Improvement |
|---|---|---|---|---|
| 2024 | $2,382 | $37,065 | $15,015 | $22,050 |
| 2023 | $2,386 | $37,065 | $15,015 | $22,050 |
| 2022 | $1,892 | $26,320 | $13,258 | $13,062 |
| 2021 | $1,848 | $26,320 | $13,258 | $13,062 |
| 2020 | $1,854 | $26,320 | $13,258 | $13,062 |
| 2019 | $949 | $12,103 | $2,009 | $10,094 |
| 2018 | $950 | $12,103 | $2,009 | $10,094 |
| 2017 | $914 | $12,103 | $2,009 | $10,094 |
| 2016 | $1,139 | $14,784 | $2,247 | $12,537 |
| 2015 | $1,020 | $14,784 | $2,247 | $12,537 |
| 2014 | $1,025 | $14,784 | $2,247 | $12,537 |
| 2013 | $1,073 | $15,243 | $2,317 | $12,926 |
Source: Public Records
Map
Nearby Homes
- 942 Summit Ave
- 922 Summit Ave
- 918 Mount Hope Ave
- 810 Summit Ave
- 2519 Warsaw Ave
- 2711 Price Ave
- 2816 Warsaw Ave
- 2500 Warsaw Ave
- 2810 Eighth St W
- 2425 Glenway Ave
- 2617 Eighth St W
- 810 Matson Place
- 2353 Wilder Ave
- 2358 Glenway Ave
- 2540 Ring Place
- 1047 Parkson Place
- 817 Hawthorne Ave
- 720 Grand Ave
- 817 Considine Ave
- 2911 Glenway Ave
- 933 Mount Hope Ave
- 2525 Morrow Place
- 927 Mount Hope Ave
- 940 Summit Ave
- 944 Summit Ave
- 928 Mount Hope Ave
- 932 Summit Ave
- 948 Summit Ave
- 925 Mount Hope Ave
- 926 Mt Hope Ave Unit 2
- 2680 Morrow Place
- 930 Summit Ave
- 930 Summit Ave Unit 932
- 2676 Morrow Place
- 926 Mount Hope Ave
- 2672 Morrow Place
- 950 Summit Ave
- 926 Summit Ave
- 924 Mount Hope Ave
- 2700 Morrow Place