2703 Signature Cir Unit Bldg-Unit Pinckney, MI 48169
Estimated Value: $413,746 - $464,000
3
Beds
3
Baths
2,105
Sq Ft
$205/Sq Ft
Est. Value
About This Home
This home is located at 2703 Signature Cir Unit Bldg-Unit, Pinckney, MI 48169 and is currently estimated at $430,687, approximately $204 per square foot. 2703 Signature Cir Unit Bldg-Unit is a home located in Livingston County with nearby schools including Country Elementary School, Navigator School, and Pathfinder School.
Ownership History
Date
Name
Owned For
Owner Type
Purchase Details
Closed on
Aug 23, 2021
Sold by
Lummis Jason A
Bought by
Loger William
Current Estimated Value
Purchase Details
Closed on
May 10, 2021
Sold by
Erskine Patricia and Murphy Patricia Ellen
Bought by
Lummis Jason A
Purchase Details
Closed on
Aug 15, 2018
Sold by
Bidwell Douglas J and Budwell Mary L
Bought by
Erskine Patricia
Purchase Details
Closed on
Jan 4, 2014
Sold by
Burgei Rissell J and Burgei Bonnie M
Bought by
Burgei Russell J and Burgei Bonnie M
Purchase Details
Closed on
Jul 1, 2013
Sold by
Williamson James P and Williamson Lyn L
Bought by
Bidwell Douglas J and Bidwell Mary L
Purchase Details
Closed on
Dec 22, 2003
Sold by
Whispering Pines Development Co Llc
Bought by
Cw Development Llc
Create a Home Valuation Report for This Property
The Home Valuation Report is an in-depth analysis detailing your home's value as well as a comparison with similar homes in the area
Home Values in the Area
Average Home Value in this Area
Purchase History
| Date | Buyer | Sale Price | Title Company |
|---|---|---|---|
| Loger William | $334,500 | Select Title Company | |
| Lummis Jason A | -- | None Listed On Document | |
| Erskine Patricia | $295,000 | -- | |
| Bidwell Douglas J | -- | -- | |
| Burgei Russell J | -- | -- | |
| Bidwell Douglas J | $225,000 | -- | |
| Cw Development Llc | $45,000 | Seaver Title |
Source: Public Records
Tax History Compared to Growth
Tax History
| Year | Tax Paid | Tax Assessment Tax Assessment Total Assessment is a certain percentage of the fair market value that is determined by local assessors to be the total taxable value of land and additions on the property. | Land | Improvement |
|---|---|---|---|---|
| 2025 | $1,562 | $180,710 | $0 | $0 |
| 2024 | $1,517 | $168,100 | $0 | $0 |
| 2023 | $1,447 | $162,010 | $0 | $0 |
| 2022 | $2,701 | $138,120 | $0 | $0 |
| 2021 | $3,618 | $138,120 | $0 | $0 |
| 2020 | $3,759 | $133,030 | $0 | $0 |
| 2019 | $3,536 | $127,000 | $0 | $0 |
| 2018 | $3,167 | $116,490 | $0 | $0 |
| 2017 | $2,998 | $116,490 | $0 | $0 |
| 2016 | $2,981 | $112,970 | $0 | $0 |
| 2014 | $2,203 | $107,200 | $0 | $0 |
| 2012 | $2,203 | $94,440 | $0 | $0 |
Source: Public Records
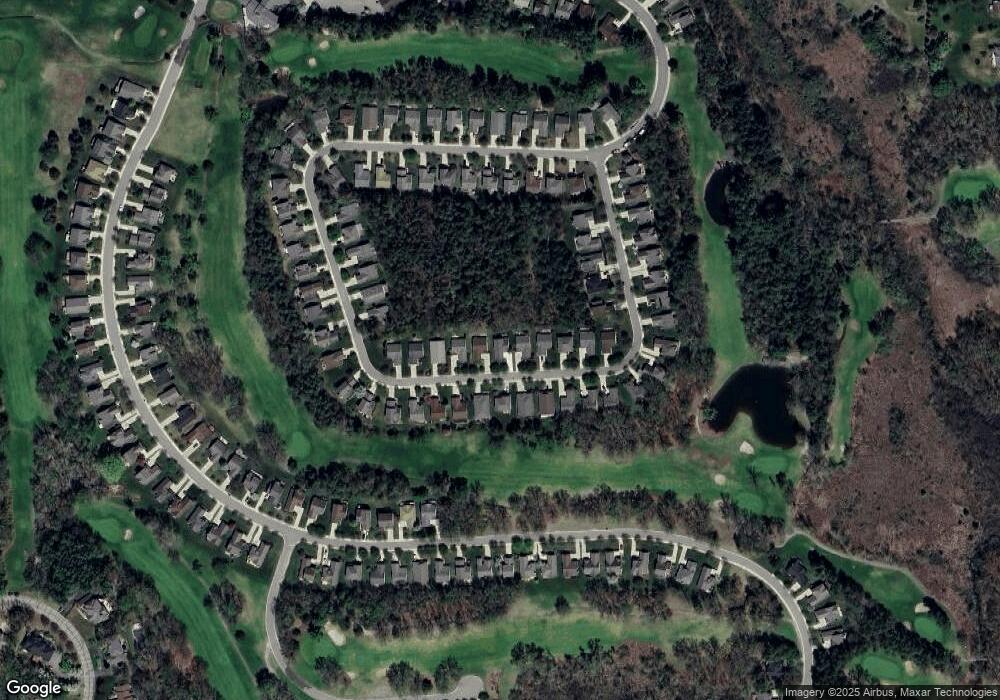
Map
Nearby Homes
- 9993 Tioga Trail Unit 154
- 10350 Half Moon Dr
- 9970 Whispering Woods Dr
- 10617 E Splitstone
- 2540 Lister Dr
- 10499 Michael Blvd
- 9418 Charlie Brown Ln
- 2384 Hay Creek Dr
- 3450 Hooker Rd
- 8883 Redstone Dr Unit 2
- 3590 Habitat Trail Unit 25
- 3333 Junior Dr
- 00 Colony
- 3569 Recreation
- 11026 Colony Rd
- 8726 Sunrise Mist Dr
- 11109 Wynns Rd
- 8431 Baudine Rd
- 9123 Oneida Way
- 11770 Woodview
- 2703 Signature Cir Unit 91
- 2709 Signature Cir Unit 92
- 2697 Signature Cir
- 0 Signature Cir
- 2715 Signature Cir
- 2691 Signature Cir Unit 89
- 2710 Signature Cir Unit 51
- 2712 Signature Cir
- 2712 Signature Cir Unit 52
- 2706 Signature Cir Unit 50
- 2721 Signature Cir
- 2721 Signature Cir Unit 94
- 2685 Signature Cir
- 2720 Signature Cir Unit 53
- 2700 Signature Cir Unit 49
- 2724 Signature Cir
- 2727 Signature Cir Unit 95
- 2679 Signature Cir
- 2694 Signature Cir Unit 48
- 2730 Signature Cir Unit 55