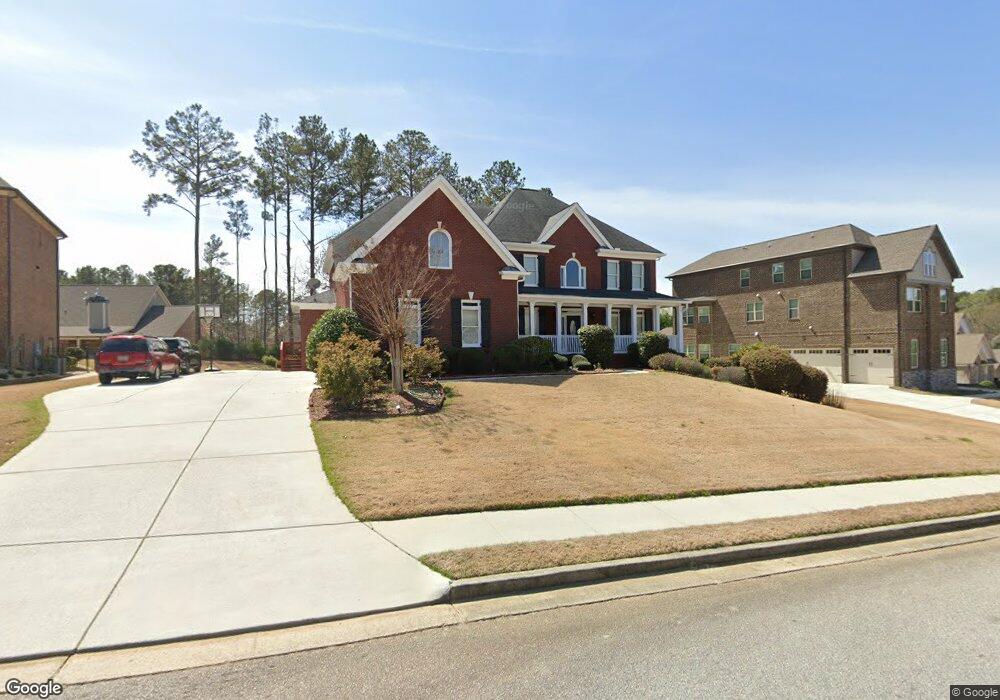
2703 Trip Hollow Way Grayson, GA 30017
Estimated Value: $712,000 - $991,000
6
Beds
4
Baths
3,660
Sq Ft
$218/Sq Ft
Est. Value
About This Home
This home is located at 2703 Trip Hollow Way, Grayson, GA 30017 and is currently estimated at $797,437, approximately $217 per square foot. 2703 Trip Hollow Way is a home located in Gwinnett County with nearby schools including Grayson Elementary School, Bay Creek Middle School, and Grayson High School.
Ownership History
Date
Name
Owned For
Owner Type
Purchase Details
Closed on
Aug 12, 2024
Sold by
Agbeyomi Modupe O
Bought by
Agbeyomi Modupe O and Agbeyomi Olukayode A
Current Estimated Value
Purchase Details
Closed on
Oct 7, 2011
Sold by
Markel Steven
Bought by
Agbeyomi Modupe O
Home Financials for this Owner
Home Financials are based on the most recent Mortgage that was taken out on this home.
Original Mortgage
$321,096
Interest Rate
4.5%
Mortgage Type
FHA
Purchase Details
Closed on
Feb 23, 2007
Sold by
Homes By Jones Inc
Bought by
Markel Steven and Markel Bridgett
Home Financials for this Owner
Home Financials are based on the most recent Mortgage that was taken out on this home.
Original Mortgage
$400,000
Interest Rate
6.16%
Mortgage Type
New Conventional
Purchase Details
Closed on
Aug 4, 2006
Sold by
Grayson-Rosebud Partners Llc
Bought by
Homes By Jones Inc
Create a Home Valuation Report for This Property
The Home Valuation Report is an in-depth analysis detailing your home's value as well as a comparison with similar homes in the area
Home Values in the Area
Average Home Value in this Area
Purchase History
| Date | Buyer | Sale Price | Title Company |
|---|---|---|---|
| Agbeyomi Modupe O | -- | -- | |
| Agbeyomi Modupe O | $334,650 | -- | |
| Markel Steven | $510,000 | -- | |
| Homes By Jones Inc | -- | -- |
Source: Public Records
Mortgage History
| Date | Status | Borrower | Loan Amount |
|---|---|---|---|
| Previous Owner | Agbeyomi Modupe O | $321,096 | |
| Previous Owner | Markel Steven | $400,000 |
Source: Public Records
Tax History Compared to Growth
Tax History
| Year | Tax Paid | Tax Assessment Tax Assessment Total Assessment is a certain percentage of the fair market value that is determined by local assessors to be the total taxable value of land and additions on the property. | Land | Improvement |
|---|---|---|---|---|
| 2025 | $8,593 | $301,480 | $44,120 | $257,360 |
| 2024 | $8,828 | $303,720 | $44,120 | $259,600 |
| 2023 | $8,828 | $266,960 | $55,200 | $211,760 |
| 2022 | $7,715 | $251,240 | $46,400 | $204,840 |
| 2021 | $6,461 | $185,600 | $36,000 | $149,600 |
| 2020 | $6,372 | $179,440 | $36,000 | $143,440 |
| 2019 | $6,158 | $179,440 | $36,000 | $143,440 |
| 2018 | $5,868 | $167,040 | $28,000 | $139,040 |
| 2016 | $5,799 | $162,880 | $28,000 | $134,880 |
| 2015 | $5,862 | $162,880 | $28,000 | $134,880 |
| 2014 | $5,429 | $147,480 | $28,000 | $119,480 |
Source: Public Records
Map
Nearby Homes
- 2435 Cobble Creek Ln
- 737 Heritage Post Ln
- 2265 Cobble Creek Ln
- 2609 Jacobs Crest Cove
- 692 Heritage Post Ln
- 2740 Heritage Bend Ct
- 936 Lakeview Oaks Ct
- 936 Lakeview Oaks Ct Unit 30-B
- 946 Lakeview Oaks Ct
- 946 Ct
- 2520 Cobble Creek Ln
- 627 Heritage Post Ln
- 956 Lakeview Oaks Ct
- 2238 Roseberry Ln
- 2228 Roseberry Ln
- 679 Crystal Cove Ct
- 2382 Alexander Top Place
- 760 Windsor Place Cir
- 0 Trip Hollow Way Unit 9052563
- 0 Trip Hollow Way Unit 7191924
- 0 Trip Hollow Way Unit 7282557
- 2693 Trip Hollow Way
- 2713 Trip Hollow Way
- 896 Coopers Ridge Path
- 906 Coopers Ridge Path
- 886 Coopers Ridge Path
- 886 Coopers Ridge Path
- 2702 Trip Hollow Way Unit 31
- 2702 Trip Hollow Way
- 2723 Trip Hollow Way
- 2683 Trip Hollow Way
- 2692 Trip Hollow Way Unit 30
- 2712 Trip Hollow Way
- 2712 Trip Hollow Way Unit 32
- 2682 Trip Hollow Way
- 891 Cooper Ridge Place
- 866 Coopers Ridge Path
- 2722 Trip Hollow Way