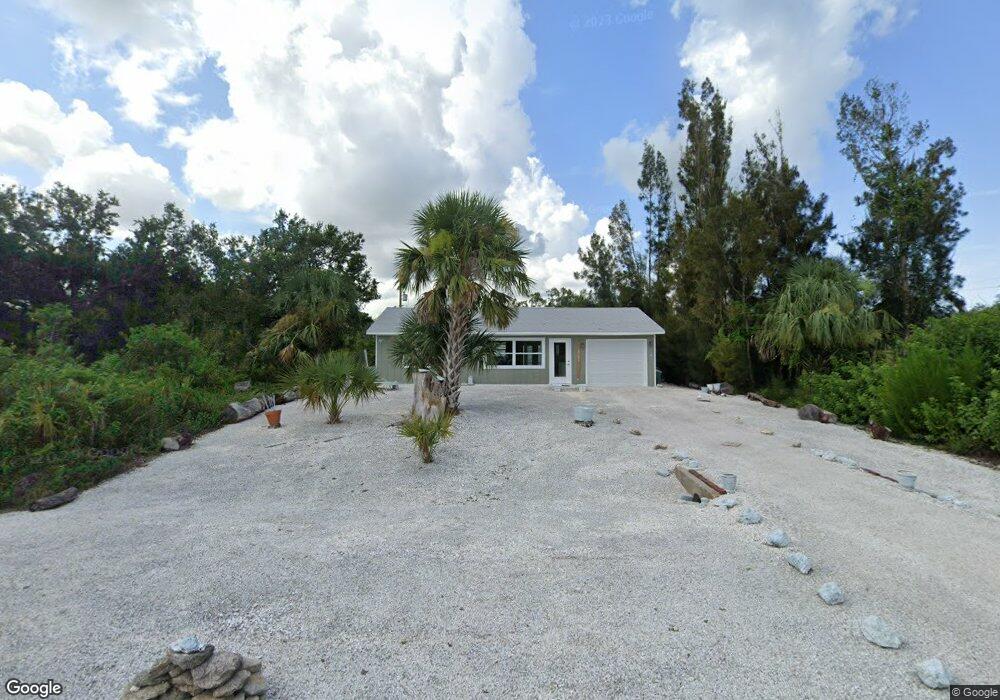
27033 Monte Cristo Blvd Punta Gorda, FL 33955
South Punta Gorda NeighborhoodEstimated Value: $141,937 - $208,000
1
Bed
1
Bath
744
Sq Ft
$246/Sq Ft
Est. Value
About This Home
This home is located at 27033 Monte Cristo Blvd, Punta Gorda, FL 33955 and is currently estimated at $182,984, approximately $245 per square foot. 27033 Monte Cristo Blvd is a home located in Charlotte County with nearby schools including East Elementary School, Punta Gorda Middle School, and Charlotte High School.
Ownership History
Date
Name
Owned For
Owner Type
Purchase Details
Closed on
Dec 14, 2021
Sold by
Future Naturals Llc
Bought by
Torjman Mireille Nina
Current Estimated Value
Purchase Details
Closed on
Sep 22, 2011
Sold by
Beaman Stacy L
Bought by
Future Naturals Llc
Purchase Details
Closed on
Jun 25, 2001
Sold by
Rodriguez Hector
Bought by
Beaman Stacy L
Home Financials for this Owner
Home Financials are based on the most recent Mortgage that was taken out on this home.
Original Mortgage
$55,100
Interest Rate
7.14%
Purchase Details
Closed on
Sep 22, 2000
Sold by
Veterans Affairs
Bought by
Rodriguez Hector
Home Financials for this Owner
Home Financials are based on the most recent Mortgage that was taken out on this home.
Original Mortgage
$26,000
Interest Rate
7.94%
Purchase Details
Closed on
Apr 14, 1998
Sold by
Clerk Circuit Court
Bought by
Veterans Affairs
Create a Home Valuation Report for This Property
The Home Valuation Report is an in-depth analysis detailing your home's value as well as a comparison with similar homes in the area
Home Values in the Area
Average Home Value in this Area
Purchase History
| Date | Buyer | Sale Price | Title Company |
|---|---|---|---|
| Torjman Mireille Nina | $100 | None Listed On Document | |
| Future Naturals Llc | $21,800 | Attorney | |
| Beaman Stacy L | $58,000 | -- | |
| Rodriguez Hector | $15,600 | -- | |
| Veterans Affairs | -- | -- |
Source: Public Records
Mortgage History
| Date | Status | Borrower | Loan Amount |
|---|---|---|---|
| Previous Owner | Beaman Stacy L | $55,100 | |
| Previous Owner | Rodriguez Hector | $26,000 |
Source: Public Records
Tax History Compared to Growth
Tax History
| Year | Tax Paid | Tax Assessment Tax Assessment Total Assessment is a certain percentage of the fair market value that is determined by local assessors to be the total taxable value of land and additions on the property. | Land | Improvement |
|---|---|---|---|---|
| 2025 | $1,690 | $93,332 | $10,200 | $83,132 |
| 2024 | $1,690 | $106,236 | -- | -- |
| 2023 | $1,642 | $103,142 | $0 | $0 |
| 2022 | $1,560 | $100,138 | $7,225 | $92,913 |
| 2021 | $1,463 | $59,770 | $2,550 | $57,220 |
| 2020 | $1,395 | $59,703 | $2,210 | $57,493 |
| 2019 | $1,280 | $56,086 | $2,210 | $53,876 |
| 2018 | $1,130 | $52,822 | $2,210 | $50,612 |
| 2017 | $1,080 | $49,012 | $2,210 | $46,802 |
| 2016 | $1,025 | $29,788 | $0 | $0 |
| 2015 | $964 | $27,080 | $0 | $0 |
| 2014 | $826 | $24,618 | $0 | $0 |
Source: Public Records
Map
Nearby Homes
- 27110 Monte Cristo Blvd
- 27101 Savoy Dr
- 27095 Savoy Dr
- 13337 Alandra Dr
- 13310 Carousel Dr
- 27130 Savoy Dr
- 13351 Easel Dr
- 13375 Green Gulf Blvd
- 27059 Capistrano Dr
- 27051 Capistrano Dr
- 27098 Capistrano Dr
- 27065 Aloha Dr
- 27054 San Pablo Dr
- 13142 Panatella Dr
- 13115 Panatella Dr Unit 31 & 32
- 13115 Panatella Dr
- 27066 San Pablo Dr
- 13317 Tribune Blvd
- 13305 Tribune Blvd
- 13323 Tribune Blvd
- 27032 Mushroom Dr
- 27026 Mushroom Dr
- 13212 Green Gulf Blvd
- 13229 Green Gulf Blvd
- 13234 Sulky Dr
- 27066 Mushroom Dr
- 28177 Monte Cristo Blvd
- 13234 & 13226 Sulky Dr
- 13204 Green Gulf Blvd
- 13265 Green Gulf Blvd
- 13265 & 13 Green Gulf Blvd
- 13197 Sulky Dr
- 13271 Green Gulf Blvd
- 27063 or 27069 Mushroom Dr
- 27063 Mushroom Dr
- 13285 Green Gulf Blvd
- 13283 Sulky Dr
- 27070 Saffron Dr Unit 12
- 13369 Alandra Dr
- 27028 Saffron Dr