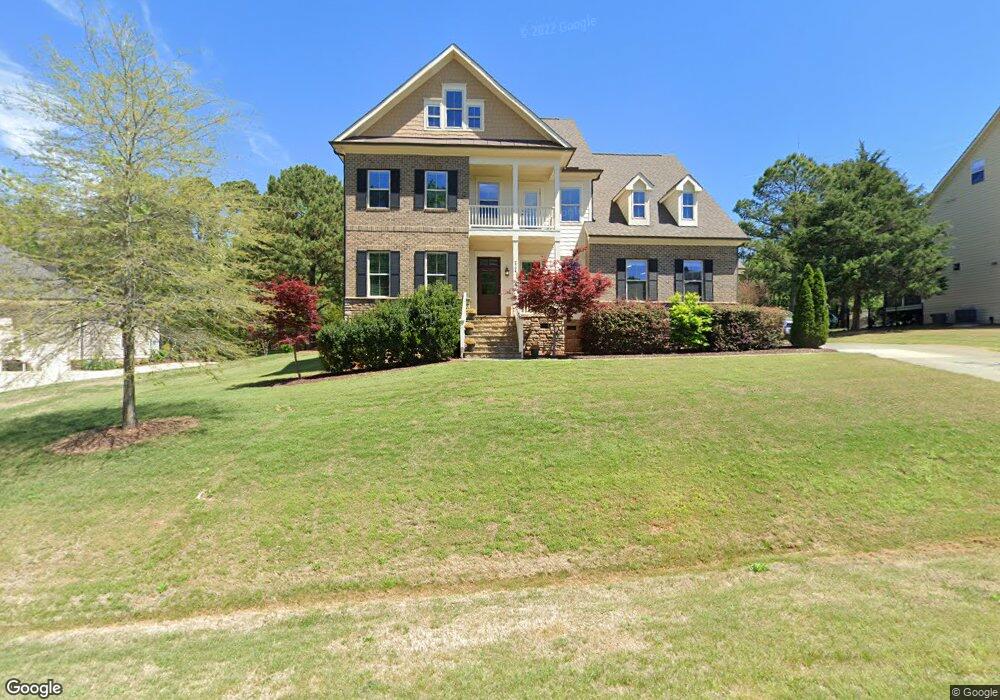
2704 Branston Way Unit 27 Apex, NC 27539
Middle Creek NeighborhoodEstimated Value: $1,104,000 - $1,195,000
--
Bed
1
Bath
4,207
Sq Ft
$272/Sq Ft
Est. Value
About This Home
This home is located at 2704 Branston Way Unit 27, Apex, NC 27539 and is currently estimated at $1,142,783, approximately $271 per square foot. 2704 Branston Way Unit 27 is a home located in Wake County with nearby schools including Yates Mill Elementary School, Dillard Drive Magnet Middle School, and Middle Creek High.
Ownership History
Date
Name
Owned For
Owner Type
Purchase Details
Closed on
Mar 24, 2023
Sold by
Youakim Francois G
Bought by
4641 Timbermill Court Trust and Jehovah Raah Llc
Current Estimated Value
Purchase Details
Closed on
Aug 29, 2013
Sold by
Ashton Raleigh Residential L L C
Bought by
Wong Jack P and Jimeson Sarah G
Home Financials for this Owner
Home Financials are based on the most recent Mortgage that was taken out on this home.
Original Mortgage
$340,000
Interest Rate
4.39%
Mortgage Type
New Conventional
Purchase Details
Closed on
Jan 6, 2011
Sold by
M&W Partners Llc
Bought by
Mayberry Real Estate Holdings Llc
Purchase Details
Closed on
Apr 16, 2007
Sold by
Builder Resource & Development Co Lp
Bought by
M&W Partners Llc
Create a Home Valuation Report for This Property
The Home Valuation Report is an in-depth analysis detailing your home's value as well as a comparison with similar homes in the area
Home Values in the Area
Average Home Value in this Area
Purchase History
| Date | Buyer | Sale Price | Title Company |
|---|---|---|---|
| 4641 Timbermill Court Trust | -- | None Listed On Document | |
| Wong Jack P | $441,500 | None Available | |
| Mayberry Real Estate Holdings Llc | $70,000 | None Available | |
| M&W Partners Llc | $315,000 | None Available |
Source: Public Records
Mortgage History
| Date | Status | Borrower | Loan Amount |
|---|---|---|---|
| Previous Owner | Wong Jack P | $340,000 |
Source: Public Records
Tax History Compared to Growth
Tax History
| Year | Tax Paid | Tax Assessment Tax Assessment Total Assessment is a certain percentage of the fair market value that is determined by local assessors to be the total taxable value of land and additions on the property. | Land | Improvement |
|---|---|---|---|---|
| 2025 | $6,522 | $1,016,619 | $170,000 | $846,619 |
| 2024 | $6,333 | $1,016,619 | $170,000 | $846,619 |
| 2023 | $5,340 | $682,370 | $100,000 | $582,370 |
| 2022 | $4,948 | $682,370 | $100,000 | $582,370 |
| 2021 | $4,815 | $682,370 | $100,000 | $582,370 |
| 2020 | $4,735 | $682,370 | $100,000 | $582,370 |
| 2019 | $4,719 | $575,393 | $112,000 | $463,393 |
| 2018 | $4,338 | $575,393 | $112,000 | $463,393 |
| 2017 | $4,111 | $575,393 | $112,000 | $463,393 |
| 2016 | $3,986 | $569,383 | $112,000 | $457,383 |
| 2015 | $4,020 | $575,904 | $140,000 | $435,904 |
| 2014 | $3,809 | $575,904 | $140,000 | $435,904 |
Source: Public Records
Map
Nearby Homes
- 2408 Tiltonshire Ln
- 2605 Wingate Hill Ct
- 3809 Victorian Grace Ln
- 8004 Deer Meadow Dr
- 3713 Highland Creek Dr
- 6512 Ten Rd
- 3901 Orchard Point Ct
- 4012 Graham Newton Rd
- 7513 Orchard Crest Ct
- 8008 Deer Meadow Dr
- 3710 Johnson Pond Rd
- 2901 Hunters Bluff Dr
- 5401 Lower Creek Ct
- 8104 Rhodes Rd
- 2926 Bells Pointe Ct
- 5728 Carriagehouse Ct
- 8012 Penny Rd
- 8016 Penny Rd
- 8201 Rhodes Rd
- 3716 Cross Timber Ln
- 2704 Branston Way
- 2700 Branston Way
- 2700 Branston Way Unit 28
- 2708 Branston Way
- 2640 Branston Way
- 2640 Branston Way Unit 29
- 0 Callowhill Ct Unit 1890262
- 0 Callowhill Ct Unit 14 TR1890262
- 1000 Callowhill Ct
- 1000 Callowhill Ct Unit 16
- 2712 Branston Way
- 2712 Branston Way Unit 25
- 2709 Branston Way
- 2709 Branston Way Unit 17
- 7432 Bleasdale Ct
- 7428 Bleasdale Ct
- 7428 Bleasdale Ct Unit 33
- 7436 Bleasdale Ct
- 1001 Callowhill Ct
- 7424 Bleasdale Ct