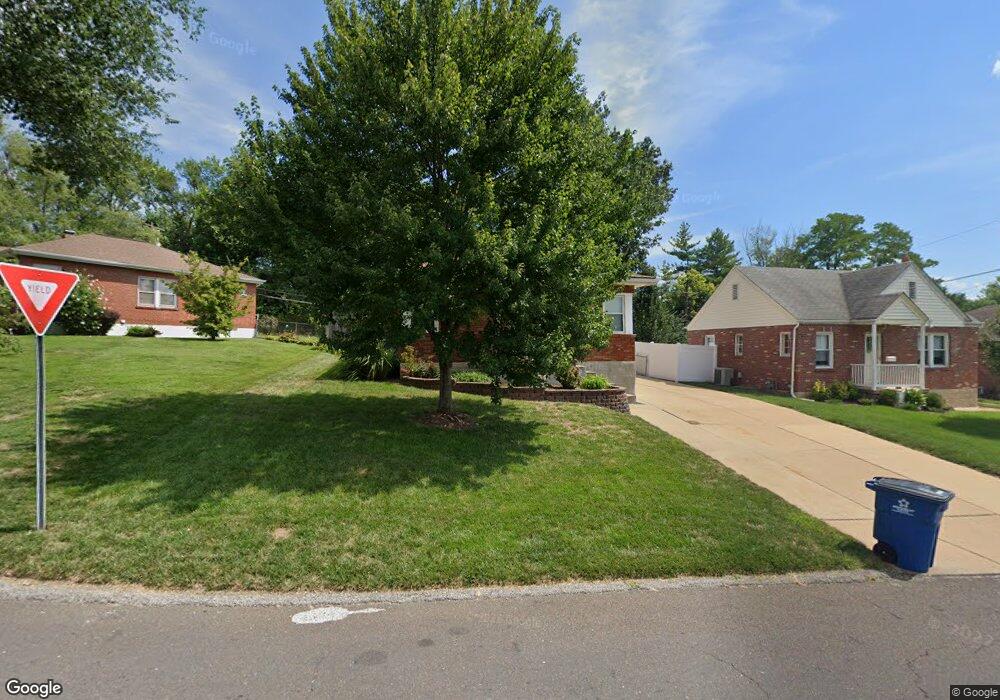
2704 Granda Dr Saint Louis, MO 63125
Mehlville NeighborhoodEstimated Value: $180,000 - $214,000
2
Beds
1
Bath
918
Sq Ft
$213/Sq Ft
Est. Value
About This Home
This home is located at 2704 Granda Dr, Saint Louis, MO 63125 and is currently estimated at $195,236, approximately $212 per square foot. 2704 Granda Dr is a home located in St. Louis County with nearby schools including Forder Elementary School, Margaret Buerkle Middle School, and Mehlville High School.
Ownership History
Date
Name
Owned For
Owner Type
Purchase Details
Closed on
Jun 15, 2021
Sold by
Filla Vincent R and Filla Denise R
Bought by
Filla Vincent R and Filla Denise R
Current Estimated Value
Purchase Details
Closed on
Feb 4, 2020
Sold by
Filla Vincent R and Estate Of Mary Lou Filla
Bought by
Filla Vincent R
Purchase Details
Closed on
Oct 16, 2019
Sold by
Filla Kasim Angela
Bought by
Filla Vincent
Purchase Details
Closed on
Oct 11, 2019
Sold by
Hernandez Jeannie
Bought by
Filla Vincent
Purchase Details
Closed on
Aug 19, 2013
Sold by
Filla Cindy
Bought by
Filla Mary Lou
Purchase Details
Closed on
Aug 20, 1999
Sold by
Atkins Michael A and Atkins Kimberly L
Bought by
Filla Cindy
Home Financials for this Owner
Home Financials are based on the most recent Mortgage that was taken out on this home.
Original Mortgage
$63,920
Interest Rate
7.75%
Create a Home Valuation Report for This Property
The Home Valuation Report is an in-depth analysis detailing your home's value as well as a comparison with similar homes in the area
Home Values in the Area
Average Home Value in this Area
Purchase History
| Date | Buyer | Sale Price | Title Company |
|---|---|---|---|
| Filla Vincent R | -- | None Available | |
| Filla Vincent R | -- | None Listed On Document | |
| Filla Vincent R | -- | None Available | |
| Filla Vincent | -- | None Available | |
| Filla Vincent | -- | None Available | |
| Filla Mary Lou | $73,179 | None Available | |
| Filla Cindy | $79,900 | -- |
Source: Public Records
Mortgage History
| Date | Status | Borrower | Loan Amount |
|---|---|---|---|
| Previous Owner | Filla Cindy | $63,920 | |
| Closed | Filla Cindy | $15,980 |
Source: Public Records
Tax History Compared to Growth
Tax History
| Year | Tax Paid | Tax Assessment Tax Assessment Total Assessment is a certain percentage of the fair market value that is determined by local assessors to be the total taxable value of land and additions on the property. | Land | Improvement |
|---|---|---|---|---|
| 2025 | $1,995 | $34,050 | $14,440 | $19,610 |
| 2024 | $1,995 | $29,260 | $7,940 | $21,320 |
| 2023 | $1,995 | $29,260 | $7,940 | $21,320 |
| 2022 | $1,778 | $24,490 | $7,940 | $16,550 |
| 2021 | $1,579 | $24,490 | $7,940 | $16,550 |
| 2020 | $1,588 | $23,430 | $9,410 | $14,020 |
| 2019 | $1,583 | $23,430 | $9,410 | $14,020 |
| 2018 | $1,445 | $19,270 | $6,730 | $12,540 |
| 2017 | $1,443 | $19,270 | $6,730 | $12,540 |
| 2016 | $1,293 | $16,530 | $5,020 | $11,510 |
| 2015 | $1,213 | $16,530 | $5,020 | $11,510 |
| 2014 | $1,364 | $18,450 | $4,160 | $14,290 |
Source: Public Records
Map
Nearby Homes
- 2745 Granda Dr
- 669 Bellsworth Dr
- 121 Jefferson Barracks Rd
- 660 Rochester Dr
- 600 Ellwine Dr
- 502 Nannette Dr
- 205 Grover Rd
- 317 Tacoma Dr
- 2669 Jonathan Dr
- 385 Kingston Dr
- 2907 Hubert Dr
- 2808 Westlawn St
- 701 Chevron Dr
- 304 Southampton Dr
- 2261 Eleanor Kay Dr
- 669 Vista Conn Dr
- 1153 Calley Dr Unit 1153
- 2228 Hagenstone Terrace
- 333 Pentonville Dr
- 645 Vista Conn Dr
- 2708 Granda Dr
- 2700 Granda Dr
- 2712 Granda Dr
- 318 Jeffersonian Ln
- 2716 Granda Dr
- 2703 Granda Dr
- 2715 Telegraph Rd
- 2701 Granda Dr
- 2709 Granda Dr
- 605 Jeffersonian Dr
- 2720 Granda Dr
- 2713 Granda Dr
- 609 Jeffersonian Dr
- 2708 Hawson Dr
- 2724 Granda Dr
- 2717 Granda Dr
- 613 Jeffersonian Dr
- 578 Bellsworth Dr
- 2714 Hawson Dr
- 2728 Granda Dr