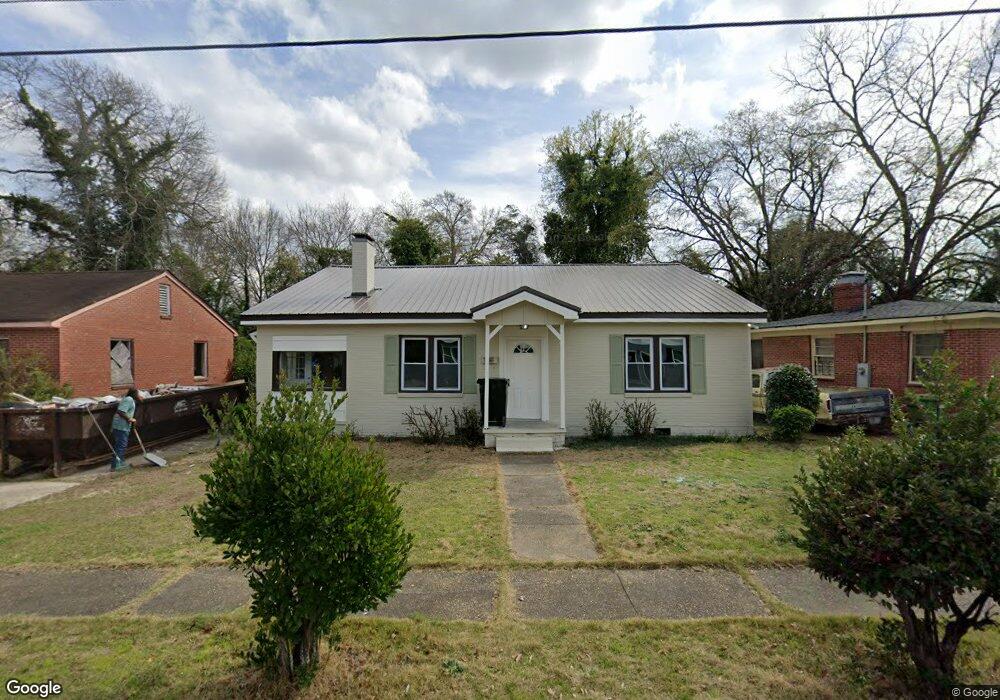
2704 Hood St Columbus, GA 31906
East Wynnton-Wynnton Hill NeighborhoodEstimated Value: $77,000 - $163,514
3
Beds
2
Baths
1,596
Sq Ft
$86/Sq Ft
Est. Value
About This Home
This home is located at 2704 Hood St, Columbus, GA 31906 and is currently estimated at $137,879, approximately $86 per square foot. 2704 Hood St is a home located in Muscogee County with nearby schools including Gulf Gate Elementary School, Brewer Elementary School, and Rothschild Leadership Academy.
Ownership History
Date
Name
Owned For
Owner Type
Purchase Details
Closed on
Apr 22, 2024
Sold by
Richardson Jesse James and Richardson Elsie Lee
Bought by
Model Family Homes Llc
Current Estimated Value
Home Financials for this Owner
Home Financials are based on the most recent Mortgage that was taken out on this home.
Original Mortgage
$38,800
Outstanding Balance
$21,450
Interest Rate
6.74%
Mortgage Type
New Conventional
Estimated Equity
$116,429
Create a Home Valuation Report for This Property
The Home Valuation Report is an in-depth analysis detailing your home's value as well as a comparison with similar homes in the area
Home Values in the Area
Average Home Value in this Area
Purchase History
| Date | Buyer | Sale Price | Title Company |
|---|---|---|---|
| Model Family Homes Llc | $48,500 | None Listed On Document |
Source: Public Records
Mortgage History
| Date | Status | Borrower | Loan Amount |
|---|---|---|---|
| Open | Model Family Homes Llc | $38,800 |
Source: Public Records
Tax History Compared to Growth
Tax History
| Year | Tax Paid | Tax Assessment Tax Assessment Total Assessment is a certain percentage of the fair market value that is determined by local assessors to be the total taxable value of land and additions on the property. | Land | Improvement |
|---|---|---|---|---|
| 2025 | $2,476 | $63,248 | $3,680 | $59,568 |
| 2024 | $10 | $25,656 | $3,680 | $21,976 |
| 2023 | $10 | $25,656 | $3,680 | $21,976 |
| 2022 | $10 | $23,528 | $3,680 | $19,848 |
| 2021 | $4 | $22,916 | $3,680 | $19,236 |
| 2020 | $4 | $22,916 | $3,680 | $19,236 |
| 2019 | $6 | $22,916 | $3,680 | $19,236 |
| 2018 | $6 | $22,916 | $3,680 | $19,236 |
| 2017 | $7 | $22,916 | $3,680 | $19,236 |
| 2016 | $8 | $14,492 | $1,324 | $13,168 |
| 2015 | $4 | $14,492 | $1,324 | $13,168 |
| 2014 | $4 | $14,492 | $1,324 | $13,168 |
| 2013 | -- | $14,492 | $1,324 | $13,168 |
Source: Public Records
Map
Nearby Homes