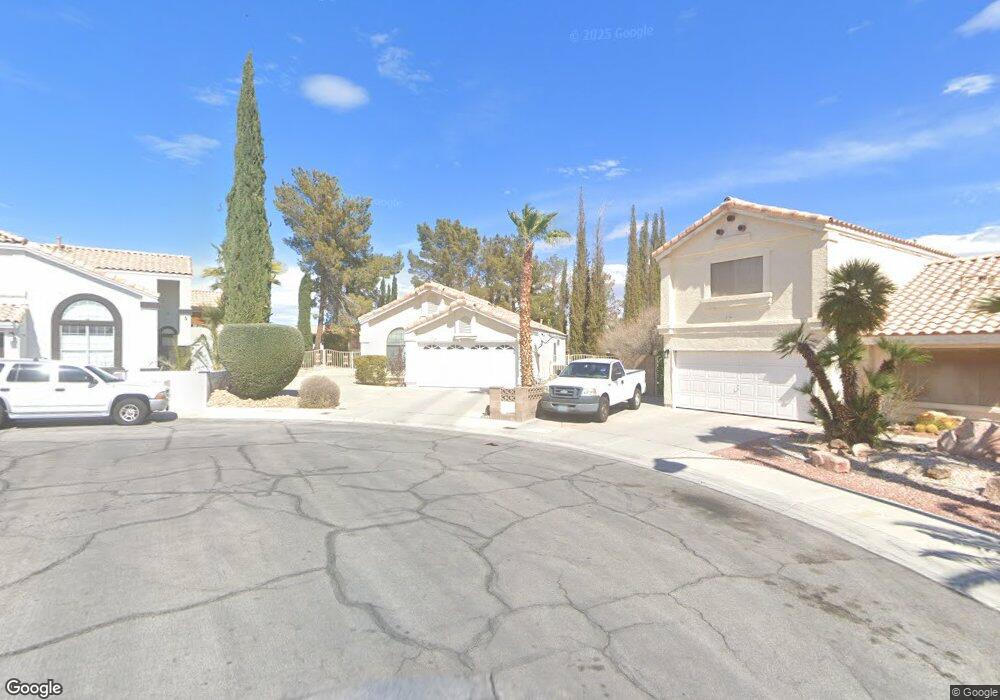
2704 Snow Cap Cir Las Vegas, NV 89117
The Section Seven NeighborhoodEstimated Value: $416,000 - $444,000
3
Beds
2
Baths
1,205
Sq Ft
$356/Sq Ft
Est. Value
About This Home
This home is located at 2704 Snow Cap Cir, Las Vegas, NV 89117 and is currently estimated at $429,510, approximately $356 per square foot. 2704 Snow Cap Cir is a home located in Clark County with nearby schools including M J Christensen Elementary School, Clifford J Lawrence Junior High School, and Bonanza High School.
Ownership History
Date
Name
Owned For
Owner Type
Purchase Details
Closed on
Apr 13, 2015
Sold by
Elder Celuta Costa
Bought by
Colclough Kyung
Current Estimated Value
Home Financials for this Owner
Home Financials are based on the most recent Mortgage that was taken out on this home.
Original Mortgage
$196,377
Outstanding Balance
$151,886
Interest Rate
3.87%
Mortgage Type
FHA
Estimated Equity
$277,624
Purchase Details
Closed on
Jul 12, 2005
Sold by
Elder Celuta C
Bought by
Elder Celuta Costa and Celuta Costa Elder Revocable Living Tr
Purchase Details
Closed on
Apr 4, 2001
Sold by
Kramer Alex and Kramer Ann W
Bought by
Elder Celuta C
Home Financials for this Owner
Home Financials are based on the most recent Mortgage that was taken out on this home.
Original Mortgage
$106,400
Interest Rate
6.98%
Create a Home Valuation Report for This Property
The Home Valuation Report is an in-depth analysis detailing your home's value as well as a comparison with similar homes in the area
Home Values in the Area
Average Home Value in this Area
Purchase History
| Date | Buyer | Sale Price | Title Company |
|---|---|---|---|
| Colclough Kyung | $200,000 | First American Title Paseo | |
| Elder Celuta Costa | -- | Land Title Of Nevada | |
| Elder Celuta C | $113,000 | Fidelity National Title |
Source: Public Records
Mortgage History
| Date | Status | Borrower | Loan Amount |
|---|---|---|---|
| Open | Colclough Kyung | $196,377 | |
| Previous Owner | Elder Celuta C | $106,400 |
Source: Public Records
Tax History Compared to Growth
Tax History
| Year | Tax Paid | Tax Assessment Tax Assessment Total Assessment is a certain percentage of the fair market value that is determined by local assessors to be the total taxable value of land and additions on the property. | Land | Improvement |
|---|---|---|---|---|
| 2025 | $2,225 | $78,204 | $38,955 | $39,249 |
| 2024 | $2,060 | $78,204 | $38,955 | $39,249 |
| 2023 | $2,060 | $78,255 | $40,425 | $37,830 |
| 2022 | $1,908 | $66,186 | $31,238 | $34,948 |
| 2021 | $1,767 | $62,121 | $28,665 | $33,456 |
| 2020 | $1,638 | $60,288 | $26,828 | $33,460 |
| 2019 | $1,535 | $62,839 | $29,645 | $33,194 |
| 2018 | $1,465 | $61,563 | $29,260 | $32,303 |
| 2017 | $1,978 | $60,323 | $27,335 | $32,988 |
| 2016 | $1,372 | $52,574 | $19,250 | $33,324 |
| 2015 | $1,368 | $46,538 | $18,095 | $28,443 |
| 2014 | $1,326 | $39,226 | $9,625 | $29,601 |
Source: Public Records
Map
Nearby Homes
- 9544 Lazy River Dr
- 2724 Monrovia Dr
- 2728 Monrovia Dr
- 2712 Quail Roost Way
- 2300 Storkspur Way
- 2729 Beachside Ct
- 9429 Abalone Way
- 9708 Blazing Star Ct
- 2913 Domino Way
- 2112 Preakness Pass Unit A
- 1829 Summit Pointe Dr
- 9113 Anchor Cove Ct
- 2200 S Fort Apache Rd Unit 2202
- 2200 S Fort Apache Rd Unit 1077
- 2200 S Fort Apache Rd Unit 2073
- 2200 S Fort Apache Rd Unit 2237
- 2200 S Fort Apache Rd Unit 1038
- 2200 S Fort Apache Rd Unit 1050
- 2200 S Fort Apache Rd Unit 1025
- 2200 S Fort Apache Rd Unit 1168
- 2708 Snow Cap Cir Unit 9A
- 2700 Snow Cap Cir
- 2701 Purtell Cir
- 2705 Purtell Cir
- 2712 Snow Cap Cir
- 2701 Snow Cap Cir
- 2709 Purtell Cir
- 2705 Snow Cap Cir Unit 9A
- 2716 Snow Cap Cir
- 2700 Purtell Cir
- 2709 Snow Cap Cir
- 2709 Snow Cap Cir
- 2709 Snow Cap Cir
- 2704 Bianca Ct
- 2713 Purtell Cir
- 2720 Snow Cap Cir
- 2708 Bianca Ct
- 2713 Snow Cap Cir
- 2704 Purtell Cir
- 2708 Purtell Cir