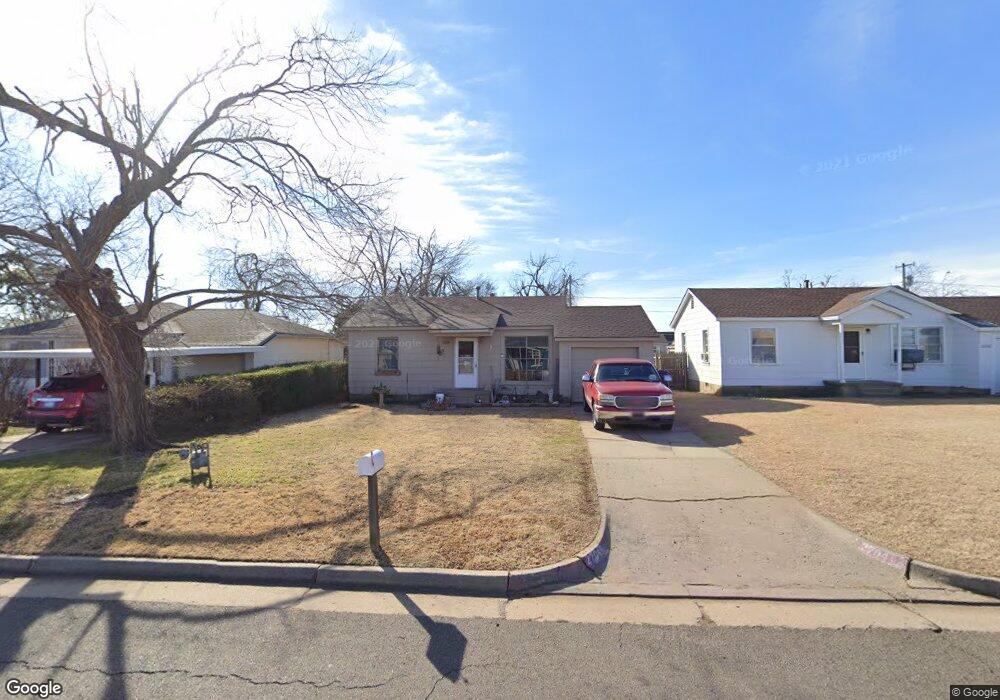
2704 SW 39th St Oklahoma City, OK 73119
Jackson NeighborhoodEstimated Value: $65,000 - $83,421
2
Beds
1
Bath
696
Sq Ft
$111/Sq Ft
Est. Value
About This Home
This home is located at 2704 SW 39th St, Oklahoma City, OK 73119 and is currently estimated at $77,105, approximately $110 per square foot. 2704 SW 39th St is a home located in Oklahoma County with nearby schools including Van Buren Elementary School, Mary Golda Ross Middle School, and Northwest Classen High School.
Ownership History
Date
Name
Owned For
Owner Type
Purchase Details
Closed on
Feb 25, 2005
Sold by
Boord Randall and Boord Lisa
Bought by
Pittmanbryant Llc
Current Estimated Value
Home Financials for this Owner
Home Financials are based on the most recent Mortgage that was taken out on this home.
Original Mortgage
$26,000
Outstanding Balance
$13,269
Interest Rate
5.71%
Mortgage Type
Purchase Money Mortgage
Estimated Equity
$63,836
Purchase Details
Closed on
Dec 30, 1999
Sold by
Joiner Richard and Joiner Wreatha
Bought by
Boord Randall and Boord Lisa
Home Financials for this Owner
Home Financials are based on the most recent Mortgage that was taken out on this home.
Original Mortgage
$5,000
Interest Rate
7.69%
Mortgage Type
Seller Take Back
Create a Home Valuation Report for This Property
The Home Valuation Report is an in-depth analysis detailing your home's value as well as a comparison with similar homes in the area
Home Values in the Area
Average Home Value in this Area
Purchase History
| Date | Buyer | Sale Price | Title Company |
|---|---|---|---|
| Pittmanbryant Llc | $26,000 | Oklahoma City Abstract & Tit | |
| Boord Randall | $5,000 | -- |
Source: Public Records
Mortgage History
| Date | Status | Borrower | Loan Amount |
|---|---|---|---|
| Open | Pittmanbryant Llc | $26,000 | |
| Previous Owner | Boord Randall | $5,000 |
Source: Public Records
Tax History Compared to Growth
Tax History
| Year | Tax Paid | Tax Assessment Tax Assessment Total Assessment is a certain percentage of the fair market value that is determined by local assessors to be the total taxable value of land and additions on the property. | Land | Improvement |
|---|---|---|---|---|
| 2024 | $572 | $5,079 | $755 | $4,324 |
| 2023 | $572 | $4,838 | $890 | $3,948 |
| 2022 | $519 | $4,608 | $1,010 | $3,598 |
| 2021 | $493 | $4,389 | $1,095 | $3,294 |
| 2020 | $474 | $4,180 | $1,193 | $2,987 |
| 2019 | $489 | $4,331 | $1,132 | $3,199 |
| 2018 | $467 | $4,126 | $0 | $0 |
| 2017 | $464 | $4,100 | $903 | $3,197 |
| 2016 | $442 | $3,904 | $908 | $2,996 |
| 2015 | $437 | $3,822 | $908 | $2,914 |
| 2014 | $425 | $3,738 | $908 | $2,830 |
Source: Public Records
Map
Nearby Homes
- 2667 SW 41st St
- 2644 SW 40th St
- 2850 SW 40th St
- 2625 SW 43rd St
- 2617 SW 43rd St
- 2912 SW 39th Terrace
- 2829 SW Grand Blvd
- 3928 S Agnew Place
- 2504 SW 35th St
- 3013 SW 40th Place
- 3068 SW 37th Place
- 3916 S Youngs Place
- 2700 SW 46th Terrace
- 2408 SW 45th St
- 2815 SW 32nd St
- 2725 Texoma Dr
- 2539 SW 32nd St
- 2624 Texoma Dr
- 2233 SW 40th St
- 4316 S Youngs Blvd
- 2700 SW 39th St
- 2708 SW 39th St
- 2712 SW 39th St
- 2716 SW 39th St
- 2705 SW 40th St
- 2709 SW 40th St
- 2701 SW 40th St
- 2713 SW 40th St
- 2660 SW 39th St
- 2720 SW 39th St
- 2705 SW 39th St
- 2701 SW 39th St
- 2709 SW 39th St
- 2717 SW 40th St
- 2713 SW 39th St
- 2724 SW 39th St
- 2715 SW 39th St
- 2721 SW 40th St
- 2661 SW 39th St
- 2656 SW 39th St