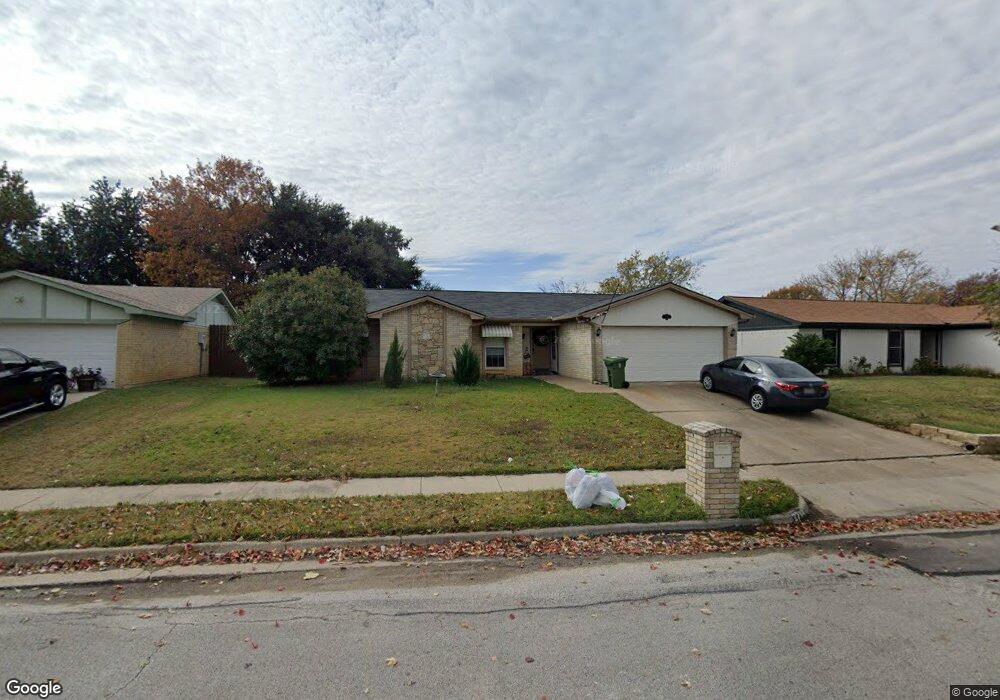
2704 Willow Bend Bedford, TX 76021
Estimated Value: $323,090 - $388,000
3
Beds
2
Baths
1,380
Sq Ft
$251/Sq Ft
Est. Value
About This Home
This home is located at 2704 Willow Bend, Bedford, TX 76021 and is currently estimated at $346,773, approximately $251 per square foot. 2704 Willow Bend is a home located in Tarrant County with nearby schools including Meadow Creek Elementary School, Harwood Junior High School, and Trinity High School.
Ownership History
Date
Name
Owned For
Owner Type
Purchase Details
Closed on
Jun 22, 2018
Sold by
Reid Michael and Reid Elizabeth
Bought by
Homesley Dillon Rhys
Current Estimated Value
Home Financials for this Owner
Home Financials are based on the most recent Mortgage that was taken out on this home.
Original Mortgage
$230,763
Outstanding Balance
$199,571
Interest Rate
4.5%
Mortgage Type
New Conventional
Estimated Equity
$147,202
Purchase Details
Closed on
Jul 23, 2015
Sold by
Evans Michael and Evans Corinne
Bought by
Reid Michael and Reid Elizabeth
Purchase Details
Closed on
Jul 24, 2000
Sold by
Park Daniel E and Park Chun O
Bought by
Evans Michael and Evans Corinne
Home Financials for this Owner
Home Financials are based on the most recent Mortgage that was taken out on this home.
Original Mortgage
$87,655
Interest Rate
8.23%
Create a Home Valuation Report for This Property
The Home Valuation Report is an in-depth analysis detailing your home's value as well as a comparison with similar homes in the area
Home Values in the Area
Average Home Value in this Area
Purchase History
| Date | Buyer | Sale Price | Title Company |
|---|---|---|---|
| Homesley Dillon Rhys | -- | Providence Title Co | |
| Reid Michael | -- | None Available | |
| Evans Michael | -- | Chicago Title Insurance |
Source: Public Records
Mortgage History
| Date | Status | Borrower | Loan Amount |
|---|---|---|---|
| Open | Homesley Dillon Rhys | $230,763 | |
| Previous Owner | Evans Michael | $87,655 |
Source: Public Records
Tax History Compared to Growth
Tax History
| Year | Tax Paid | Tax Assessment Tax Assessment Total Assessment is a certain percentage of the fair market value that is determined by local assessors to be the total taxable value of land and additions on the property. | Land | Improvement |
|---|---|---|---|---|
| 2025 | $4,352 | $286,966 | $70,000 | $216,966 |
| 2024 | $4,352 | $286,966 | $70,000 | $216,966 |
| 2023 | $5,080 | $299,376 | $45,000 | $254,376 |
| 2022 | $5,259 | $240,800 | $45,000 | $195,800 |
| 2021 | $5,538 | $235,107 | $45,000 | $190,107 |
| 2020 | $5,055 | $212,611 | $45,000 | $167,611 |
| 2019 | $5,350 | $220,237 | $45,000 | $175,237 |
| 2018 | $4,888 | $201,196 | $45,000 | $156,196 |
| 2017 | $4,410 | $182,276 | $30,000 | $152,276 |
| 2016 | $3,788 | $156,595 | $30,000 | $126,595 |
| 2015 | $3,055 | $147,079 | $30,000 | $117,079 |
| 2014 | $3,055 | $132,600 | $18,000 | $114,600 |
Source: Public Records
Map
Nearby Homes
- 2709 Willow Bend
- 2616 Greenwood Ct
- 3024 Highgate Ln
- 2600 Willow Bend
- 2922 Beachtree Ln
- 2521 Sanders Ct
- 2609 Woodson Dr
- 2700 Mimosa Ct
- 2516 Classic Ct W
- 2601 Murphy Dr
- 3001 Glenwood Ct
- 3152 Woodbridge Dr
- 2909 Oakridge Dr
- 3205 Princess St
- 3017 Bluebonnet Ln
- 2501 Murphy Dr
- 2220 Tiffany Glenn Ct
- 3100 Emerald St
- 3104 Emerald St
- 3405 Scenic Hills Dr
- 2704 Willow Bend
- 2700 Willow Bend
- 2700 Willow Bend
- 2708 Willow Bend
- 3008 Highgate Ln
- 3004 Highgate Ln
- 3012 Highgate Ln
- 2624 Willow Bend
- 2712 Willow Bend
- 3000 Highgate Ln
- 2705 Willow Bend
- 2705 Willow Bend
- 3016 Highgate Ln
- 3101 Meadow Wood Ln
- 2620 Willow Bend
- 3001 Highgate Ln
- 2930 Highgate Ln
- 3005 Highgate Ln
- 3100 Whisperwood Ln
- 2616 Willow Bend