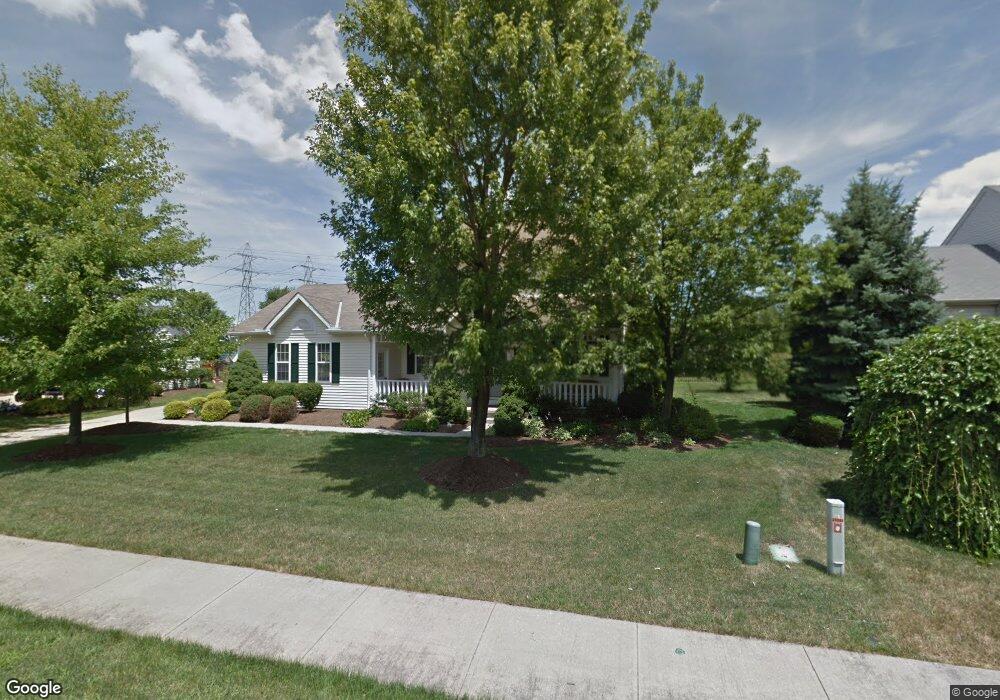
27044 Pondside Point Olmsted Falls, OH 44138
Estimated Value: $374,381 - $432,000
4
Beds
3
Baths
1,922
Sq Ft
$208/Sq Ft
Est. Value
About This Home
This home is located at 27044 Pondside Point, Olmsted Falls, OH 44138 and is currently estimated at $399,095, approximately $207 per square foot. 27044 Pondside Point is a home located in Cuyahoga County with nearby schools including Olmsted Falls Intermediate Building, Falls-Lenox Primary Elementary School, and Olmsted Falls Middle School.
Ownership History
Date
Name
Owned For
Owner Type
Purchase Details
Closed on
Aug 26, 2009
Sold by
Davis Matthew S and Davis Sandra S
Bought by
Suchan Patrick E and Suchan Maria E
Current Estimated Value
Home Financials for this Owner
Home Financials are based on the most recent Mortgage that was taken out on this home.
Original Mortgage
$226,846
Outstanding Balance
$148,507
Interest Rate
5.21%
Mortgage Type
VA
Estimated Equity
$250,588
Purchase Details
Closed on
Oct 9, 1998
Sold by
Center Properties
Bought by
Davis Matthew S and Davis Sandra S
Home Financials for this Owner
Home Financials are based on the most recent Mortgage that was taken out on this home.
Original Mortgage
$171,700
Interest Rate
6.79%
Purchase Details
Closed on
Feb 18, 1994
Sold by
Shorewest Const
Bought by
Center Properties
Purchase Details
Closed on
Jan 1, 1994
Bought by
Shorewest Const
Create a Home Valuation Report for This Property
The Home Valuation Report is an in-depth analysis detailing your home's value as well as a comparison with similar homes in the area
Home Values in the Area
Average Home Value in this Area
Purchase History
| Date | Buyer | Sale Price | Title Company |
|---|---|---|---|
| Suchan Patrick E | $219,600 | Attorney | |
| Davis Matthew S | $202,000 | Cleveland Title | |
| Center Properties | -- | -- | |
| Shorewest Const | -- | -- |
Source: Public Records
Mortgage History
| Date | Status | Borrower | Loan Amount |
|---|---|---|---|
| Open | Suchan Patrick E | $226,846 | |
| Previous Owner | Davis Matthew S | $171,700 |
Source: Public Records
Tax History Compared to Growth
Tax History
| Year | Tax Paid | Tax Assessment Tax Assessment Total Assessment is a certain percentage of the fair market value that is determined by local assessors to be the total taxable value of land and additions on the property. | Land | Improvement |
|---|---|---|---|---|
| 2024 | $8,596 | $116,025 | $23,310 | $92,715 |
| 2023 | $8,516 | $93,840 | $19,460 | $74,380 |
| 2022 | $8,458 | $93,840 | $19,460 | $74,380 |
| 2021 | $8,381 | $93,840 | $19,460 | $74,380 |
| 2020 | $8,281 | $82,320 | $17,080 | $65,240 |
| 2019 | $7,497 | $235,200 | $48,800 | $186,400 |
| 2018 | $7,162 | $82,320 | $17,080 | $65,240 |
| 2017 | $7,297 | $77,600 | $16,630 | $60,970 |
| 2016 | $7,264 | $77,600 | $16,630 | $60,970 |
| 2015 | $7,189 | $77,600 | $16,630 | $60,970 |
| 2014 | $7,189 | $75,330 | $16,140 | $59,190 |
Source: Public Records
Map
Nearby Homes
- 7296 Chestnut Ct
- 7087 Mackenzie Rd
- 7224 Pine Woods Way
- 7097 Stearns Rd
- 6926 Mackenzie Rd
- 27069 Oakwood Cir Unit 117W
- 27097 Oakwood Cir Unit 208Z
- 28130 Angela Dr
- 6752 Cypress Dr
- 6979 Warrington Dr
- 29651 Westminster Dr
- 6706 Crestwood Ln
- 27202 Cook Rd Unit 95
- 27202 Cook Rd Unit 127
- 6560 Mackenzie Rd
- 26946 Westwood Ln
- 6556 Louann Dr
- 28628 Aspen Dr
- 29880 Westminster Dr
- 3 Fiddle Sticks
- 27040 Pondside Point
- 27048 Pondside Point
- 27036 Pondside Point
- 27052 Pondside Point
- 27047 Pondside Point
- 27032 Pondside Point
- 27053 Pondside Point
- 27041 Pondside Point
- 27056 Pondside Point
- 27037 Pondside Point
- 27028 Pondside Point
- 27033 Pondside Point
- 27059 Pondside Point
- 27024 Pondside Point
- 27029 Pondside Point
- 27005 Cook Rd
- 27020 Pondside Point
- 27023 Pondside Point
- 27001 Cook Rd
- 27050 Dogwood Ln