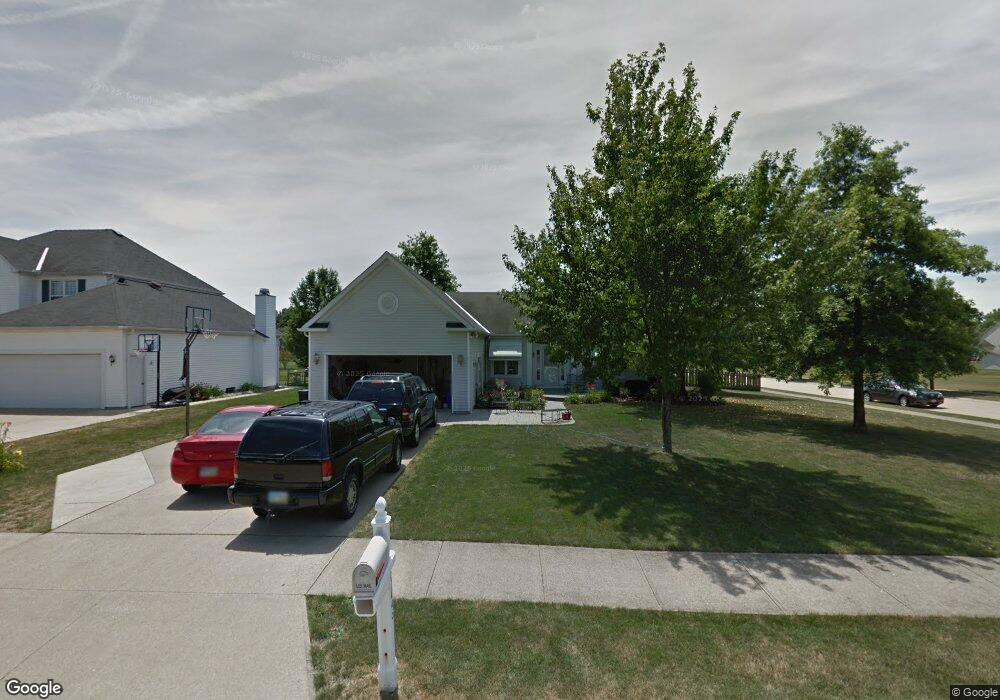
27045 Valeside Ln Olmsted Falls, OH 44138
Estimated Value: $317,117 - $389,000
3
Beds
2
Baths
1,663
Sq Ft
$212/Sq Ft
Est. Value
About This Home
This home is located at 27045 Valeside Ln, Olmsted Falls, OH 44138 and is currently estimated at $352,279, approximately $211 per square foot. 27045 Valeside Ln is a home located in Cuyahoga County with nearby schools including Olmsted Falls Intermediate Building, Falls-Lenox Primary Elementary School, and Olmsted Falls Middle School.
Ownership History
Date
Name
Owned For
Owner Type
Purchase Details
Closed on
May 22, 2001
Sold by
Banach Beverly A
Bought by
Calabrase William T and Calabrase Kimberly A
Current Estimated Value
Home Financials for this Owner
Home Financials are based on the most recent Mortgage that was taken out on this home.
Original Mortgage
$118,900
Outstanding Balance
$45,054
Interest Rate
7.23%
Estimated Equity
$307,225
Purchase Details
Closed on
Nov 27, 1998
Sold by
Banach Jane P
Bought by
Banach Beverly A
Purchase Details
Closed on
Jun 15, 1995
Sold by
Shore West Const Co
Bought by
Banach Jane P and Banach Beverly A
Purchase Details
Closed on
Jan 1, 1994
Bought by
Shorewest Const
Create a Home Valuation Report for This Property
The Home Valuation Report is an in-depth analysis detailing your home's value as well as a comparison with similar homes in the area
Home Values in the Area
Average Home Value in this Area
Purchase History
| Date | Buyer | Sale Price | Title Company |
|---|---|---|---|
| Calabrase William T | $169,900 | Guardian Title | |
| Banach Beverly A | -- | -- | |
| Banach Jane P | $169,000 | -- | |
| Shorewest Const | -- | -- |
Source: Public Records
Mortgage History
| Date | Status | Borrower | Loan Amount |
|---|---|---|---|
| Open | Calabrase William T | $118,900 |
Source: Public Records
Tax History Compared to Growth
Tax History
| Year | Tax Paid | Tax Assessment Tax Assessment Total Assessment is a certain percentage of the fair market value that is determined by local assessors to be the total taxable value of land and additions on the property. | Land | Improvement |
|---|---|---|---|---|
| 2024 | $7,061 | $92,750 | $26,250 | $66,500 |
| 2023 | $7,073 | $75,920 | $21,320 | $54,600 |
| 2022 | $7,023 | $78,440 | $22,020 | $56,420 |
| 2021 | $7,171 | $78,440 | $22,020 | $56,420 |
| 2020 | $7,087 | $68,810 | $19,320 | $49,490 |
| 2019 | $6,430 | $196,600 | $55,200 | $141,400 |
| 2018 | $6,149 | $68,810 | $19,320 | $49,490 |
| 2017 | $5,906 | $60,830 | $18,760 | $42,070 |
| 2016 | $5,879 | $60,830 | $18,760 | $42,070 |
| 2015 | $5,818 | $60,830 | $18,760 | $42,070 |
| 2014 | $5,818 | $59,050 | $18,200 | $40,850 |
Source: Public Records
Map
Nearby Homes
- 7296 Chestnut Ct
- 7224 Pine Woods Way
- 7087 Mackenzie Rd
- 7097 Stearns Rd
- 6926 Mackenzie Rd
- 27069 Oakwood Cir Unit 117W
- 29 Carl Ln
- 8706 Stearns Rd
- 27097 Oakwood Cir Unit 208Z
- 27202 Cook Rd Unit 95
- 27202 Cook Rd Unit 127
- 26788 Skyline Dr
- 29651 Westminster Dr
- 6979 Warrington Dr
- 28130 Angela Dr
- 6752 Cypress Dr
- 42 Periwinkle Dr
- 3 Fiddle Sticks
- 6706 Crestwood Ln
- 29880 Westminster Dr
- 27041 Valeside Ln
- 27053 Valeside Ln
- 27039 Valeside Ln
- 27048 Glenside Ln
- 27044 Glenside Ln
- 27057 Valeside Ln
- 27035 Valeside Ln
- 27048 Valeside Ln
- 27038 Glenside Ln
- 27052 Valeside Ln
- 27044 Valeside Ln
- 27056 Valeside Ln
- 27040 Valeside Ln
- 27031 Valeside Ln
- 27034 Glenside Ln
- 27061 Valeside Ln
- 27058 Glenside Ln
- 27060 Valeside Ln
- 27038 Valeside Ln
- 27030 Glenside Ln