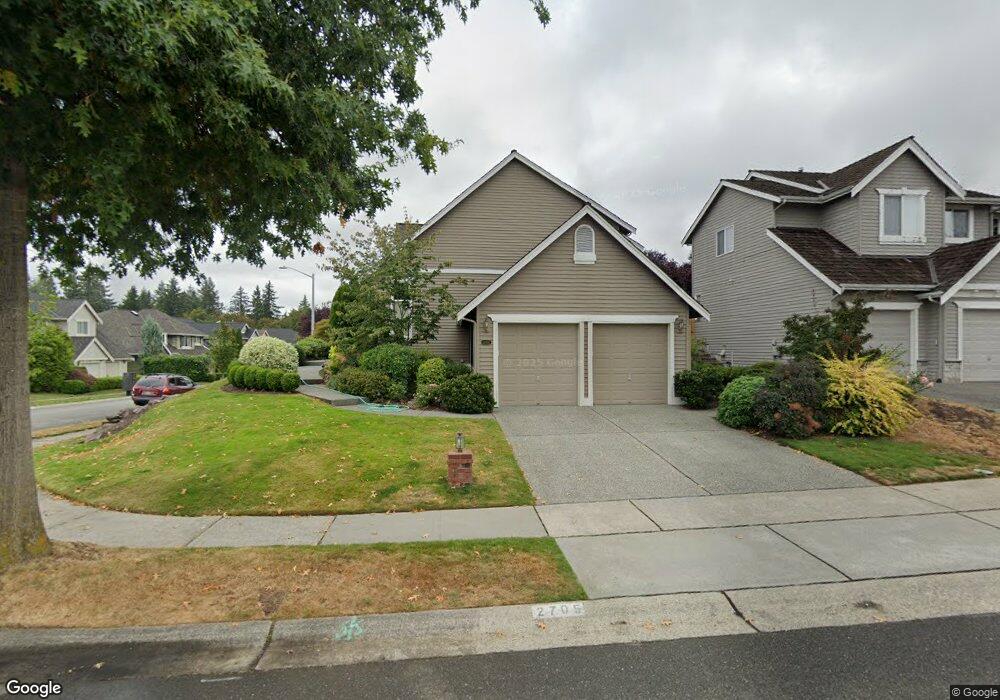
2705 202nd St SE Bothell, WA 98012
Thrasher's Corner-Red Hawk NeighborhoodEstimated Value: $1,179,000 - $1,318,000
3
Beds
3
Baths
2,364
Sq Ft
$518/Sq Ft
Est. Value
About This Home
This home is located at 2705 202nd St SE, Bothell, WA 98012 and is currently estimated at $1,225,361, approximately $518 per square foot. 2705 202nd St SE is a home located in Snohomish County with nearby schools including Canyon Creek Elementary School, Skyview Middle School, and North Creek High School.
Ownership History
Date
Name
Owned For
Owner Type
Purchase Details
Closed on
Feb 19, 2004
Sold by
Shosten Ronald W and Shosten Barbara A
Bought by
Golub Jeffrey N and Golub Martha A
Current Estimated Value
Home Financials for this Owner
Home Financials are based on the most recent Mortgage that was taken out on this home.
Original Mortgage
$130,000
Outstanding Balance
$58,685
Interest Rate
5.85%
Mortgage Type
Purchase Money Mortgage
Estimated Equity
$1,166,676
Purchase Details
Closed on
Apr 3, 2001
Sold by
Gregory Ralph L
Bought by
Shosten Ronald W and Shosten Barbara A
Home Financials for this Owner
Home Financials are based on the most recent Mortgage that was taken out on this home.
Original Mortgage
$275,000
Interest Rate
7.19%
Purchase Details
Closed on
Mar 25, 1999
Sold by
John F Buchan Construction Inc
Bought by
Gregory Ralph L
Home Financials for this Owner
Home Financials are based on the most recent Mortgage that was taken out on this home.
Original Mortgage
$210,000
Interest Rate
6.79%
Create a Home Valuation Report for This Property
The Home Valuation Report is an in-depth analysis detailing your home's value as well as a comparison with similar homes in the area
Home Values in the Area
Average Home Value in this Area
Purchase History
| Date | Buyer | Sale Price | Title Company |
|---|---|---|---|
| Golub Jeffrey N | $380,000 | First American Title Ins Co | |
| Shosten Ronald W | $355,000 | Fidelity National Title | |
| Gregory Ralph L | $300,000 | -- |
Source: Public Records
Mortgage History
| Date | Status | Borrower | Loan Amount |
|---|---|---|---|
| Open | Golub Jeffrey N | $130,000 | |
| Previous Owner | Shosten Ronald W | $275,000 | |
| Previous Owner | Gregory Ralph L | $210,000 | |
| Closed | Shosten Ronald W | $61,900 |
Source: Public Records
Tax History
| Year | Tax Paid | Tax Assessment Tax Assessment Total Assessment is a certain percentage of the fair market value that is determined by local assessors to be the total taxable value of land and additions on the property. | Land | Improvement |
|---|---|---|---|---|
| 2026 | $9,614 | $1,187,200 | $814,800 | $372,400 |
| 2025 | $8,130 | $1,144,400 | $786,500 | $357,900 |
| 2024 | $8,130 | $972,500 | $627,000 | $345,500 |
| 2023 | $8,622 | $1,124,200 | $725,000 | $399,200 |
| 2022 | $7,472 | $778,800 | $440,000 | $338,800 |
| 2020 | $8,000 | $777,800 | $414,000 | $363,800 |
| 2019 | $6,930 | $690,200 | $330,000 | $360,200 |
| 2018 | $6,457 | $606,400 | $285,000 | $321,400 |
| 2017 | $5,510 | $531,900 | $230,000 | $301,900 |
| 2016 | $5,338 | $499,300 | $210,000 | $289,300 |
| 2015 | $5,394 | $475,300 | $195,000 | $280,300 |
| 2013 | $4,605 | $352,000 | $157,000 | $195,000 |
Source: Public Records
Map
Nearby Homes
- 2115 201st Place SE Unit F4
- 2115 201st Place SE Unit K2
- 2115 201st Place SE Unit H3
- 2115 201st Place SE Unit L2
- 2200 196th St SE Unit 25
- 2200 196th St SE Unit 66
- 2200 196th St SE Unit 76
- 2200 196th St SE Unit 61
- 2200 196th St SE Unit 70
- 20501 31st Dr SE
- 19520 Grannis Rd
- 20500 32nd Dr SE
- 3125 194th St SE
- 20524 32nd Dr SE
- 2408 208th Place SE
- 19911 34th Dr SE
- 3422 201st Place SE
- 3122 194th St SE
- 3126 194th St SE
- 19218 26th Ave SE Unit 117
- 2711 202nd St SE
- 20113 27th Ave SE
- 2719 202nd St SE
- 20122 27th Ave SE
- 20114 27th Dr SE
- 20128 27th Ave SE
- 20107 27th Ave SE
- 20116 27th Ave SE
- 2704 202nd St SE
- 2712 202nd St SE
- 20202 27th Ave SE
- 20106 27th Dr SE
- 20110 27th Ave SE
- 2720 202nd St SE
- 28008 27th Dr SE
- 20033 27th Ave SE
- 20206 27th Ave SE
- 20104 27th Ave SE
- 20032 27th Dr SE
- 20121 26th Dr SE
Your Personal Tour Guide
Ask me questions while you tour the home.