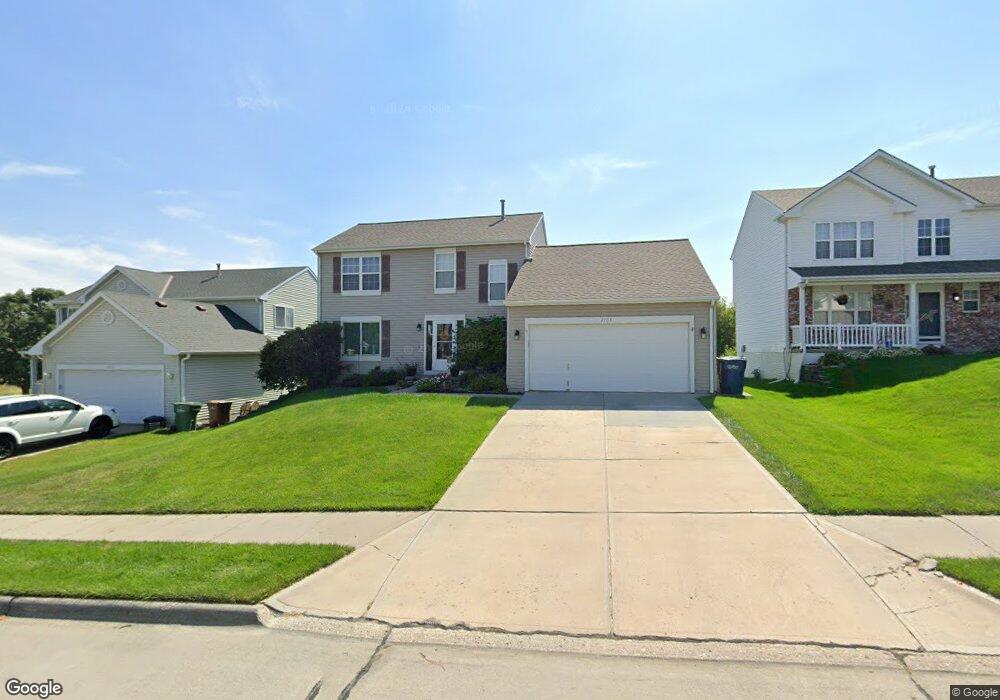
2705 Arrowhead Ln Bellevue, NE 68123
Estimated Value: $317,000 - $347,000
3
Beds
8
Baths
2,164
Sq Ft
$152/Sq Ft
Est. Value
About This Home
This home is located at 2705 Arrowhead Ln, Bellevue, NE 68123 and is currently estimated at $328,604, approximately $151 per square foot. 2705 Arrowhead Ln is a home located in Sarpy County with nearby schools including Two Springs Elementary School, Lewis & Clark Middle School, and Bellevue East High School.
Ownership History
Date
Name
Owned For
Owner Type
Purchase Details
Closed on
Jan 14, 2008
Sold by
Faiman Kelly and Faiman Mindy
Bought by
Myers Joshua J and Myers Bobby Jo
Current Estimated Value
Home Financials for this Owner
Home Financials are based on the most recent Mortgage that was taken out on this home.
Original Mortgage
$169,900
Interest Rate
5.94%
Mortgage Type
VA
Purchase Details
Closed on
Apr 30, 2003
Sold by
Tegeder Zachary J and Tegeder Angela M
Bought by
Faiman Kelly and Faiman Mindy
Home Financials for this Owner
Home Financials are based on the most recent Mortgage that was taken out on this home.
Original Mortgage
$149,611
Interest Rate
5.8%
Mortgage Type
FHA
Purchase Details
Closed on
Aug 1, 2001
Sold by
Hearthstone Homes Inc
Bought by
Tegeder Zachary J and Hunter Angela M
Home Financials for this Owner
Home Financials are based on the most recent Mortgage that was taken out on this home.
Original Mortgage
$133,066
Interest Rate
7.05%
Mortgage Type
FHA
Create a Home Valuation Report for This Property
The Home Valuation Report is an in-depth analysis detailing your home's value as well as a comparison with similar homes in the area
Home Values in the Area
Average Home Value in this Area
Purchase History
| Date | Buyer | Sale Price | Title Company |
|---|---|---|---|
| Myers Joshua J | $170,000 | Multiple | |
| Faiman Kelly | $152,000 | -- | |
| Tegeder Zachary J | $135,000 | -- |
Source: Public Records
Mortgage History
| Date | Status | Borrower | Loan Amount |
|---|---|---|---|
| Closed | Myers Joshua J | $169,900 | |
| Closed | Faiman Kelly | $149,611 | |
| Closed | Tegeder Zachary J | $133,066 |
Source: Public Records
Tax History
| Year | Tax Paid | Tax Assessment Tax Assessment Total Assessment is a certain percentage of the fair market value that is determined by local assessors to be the total taxable value of land and additions on the property. | Land | Improvement |
|---|---|---|---|---|
| 2025 | $4,470 | $272,221 | $48,000 | $224,221 |
| 2024 | $5,152 | $257,511 | $48,000 | $209,511 |
| 2023 | $5,152 | $244,006 | $44,000 | $200,006 |
| 2022 | $4,606 | $214,050 | $40,000 | $174,050 |
| 2021 | $4,338 | $199,443 | $34,000 | $165,443 |
| 2020 | $4,145 | $189,933 | $34,000 | $155,933 |
| 2019 | $4,165 | $182,299 | $34,000 | $148,299 |
| 2018 | $3,940 | $176,861 | $30,000 | $146,861 |
| 2017 | $3,737 | $166,368 | $30,000 | $136,368 |
| 2016 | $3,621 | $159,444 | $28,000 | $131,444 |
| 2015 | $3,491 | $158,207 | $28,000 | $130,207 |
| 2014 | $3,379 | $152,188 | $28,000 | $124,188 |
| 2012 | -- | $149,577 | $27,000 | $122,577 |
Source: Public Records
Map
Nearby Homes
- 13910 Kelly Dr
- 2924 Blackhawk Cir
- 3004 Lone Tree Rd
- 14109 Tregaron Ridge Ave Unit E
- 3110 Jason Cir
- 2711 Lynnwood Dr
- 2303 Coventry Dr
- 2504 Century Rd
- 14106 S 21st St
- 14206 S 30th Ave
- 2917 Daniell Cir
- 13007 S 29th Ave
- 2108 Plymouth Rock Rd
- 12901 S 29th Place
- 3106 Lynnwood Dr
- 14104 S 33rd Ave
- 14313 S 20th St
- 13507 Innis Cir
- 1928 Canyon St
- 2508 Raven Ridge Dr
- 2707 Arrowhead Ln
- 2703 Arrowhead Ln
- 2709 Arrowhead Ln
- 2706 Arrowhead Ln
- 2704 Arrowhead Ln
- 2701 Arrowhead Ln
- 2708 Arrowhead Ln
- 2801 Arrowhead Ln
- 2702 Arrowhead Ln
- 1904 Raven Ridge Dr
- 1808 Raven Ridge Dr
- 2803 Arrowhead Ln
- 2613 Arrowhead Ln
- 2802 Arrowhead Ln
- 2713 Hunter Dr
- 13610 S 27th St
- 2711 Hunter Dr
- 2715 Hunter Dr
- 2805 Arrowhead Ln
- 2804 Arrowhead Ln
Your Personal Tour Guide
Ask me questions while you tour the home.