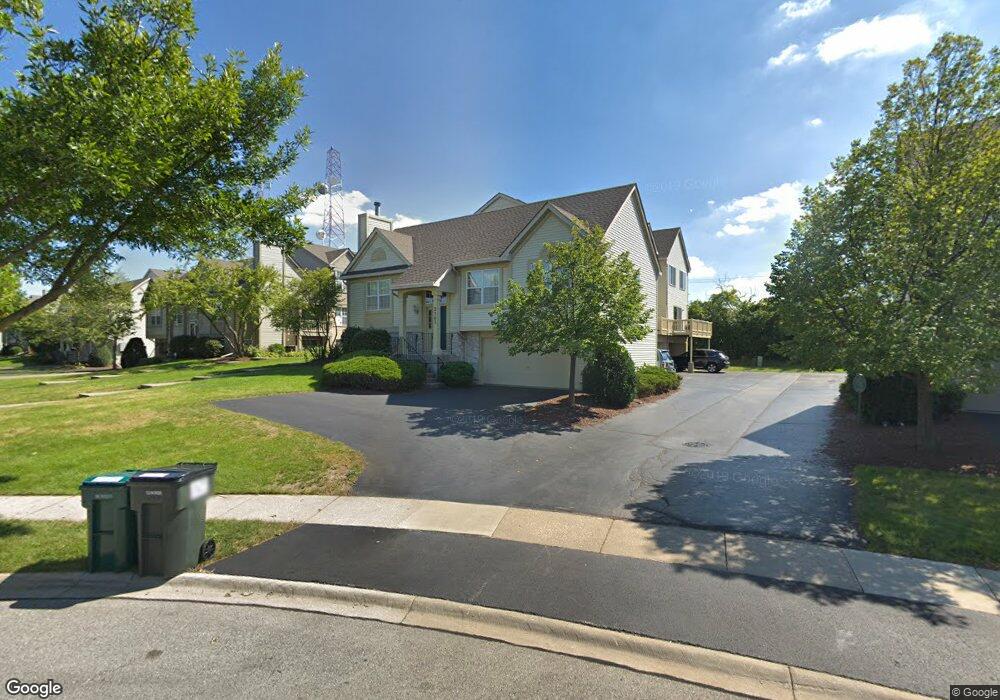
2705 Curran Ct Unit 127 Darien, IL 60561
Estimated Value: $352,821 - $375,000
3
Beds
3
Baths
1,500
Sq Ft
$245/Sq Ft
Est. Value
About This Home
This home is located at 2705 Curran Ct Unit 127, Darien, IL 60561 and is currently estimated at $367,205, approximately $244 per square foot. 2705 Curran Ct Unit 127 is a home located in DuPage County with nearby schools including Prairieview Elementary School, Elizabeth Ide Elementary School, and Lakeview Jr High School.
Ownership History
Date
Name
Owned For
Owner Type
Purchase Details
Closed on
Apr 28, 2017
Sold by
Gu Zhirong
Bought by
Hwang Tzong Y
Current Estimated Value
Purchase Details
Closed on
Feb 28, 2001
Sold by
Verven Theodore S and Zervogiannis Gus
Bought by
Wu Liping and Gu Zhirong
Home Financials for this Owner
Home Financials are based on the most recent Mortgage that was taken out on this home.
Original Mortgage
$100,000
Interest Rate
7.18%
Mortgage Type
Purchase Money Mortgage
Purchase Details
Closed on
Aug 21, 1997
Sold by
United Homes Inc
Bought by
Verven Theodore S and Zervogiannis Gus
Home Financials for this Owner
Home Financials are based on the most recent Mortgage that was taken out on this home.
Original Mortgage
$103,900
Interest Rate
7.25%
Mortgage Type
Purchase Money Mortgage
Create a Home Valuation Report for This Property
The Home Valuation Report is an in-depth analysis detailing your home's value as well as a comparison with similar homes in the area
Home Values in the Area
Average Home Value in this Area
Purchase History
| Date | Buyer | Sale Price | Title Company |
|---|---|---|---|
| Hwang Tzong Y | $215,000 | Stewart Title | |
| Wu Liping | $170,000 | -- | |
| Verven Theodore S | $141,000 | -- |
Source: Public Records
Mortgage History
| Date | Status | Borrower | Loan Amount |
|---|---|---|---|
| Previous Owner | Wu Liping | $100,000 | |
| Previous Owner | Verven Theodore S | $103,900 |
Source: Public Records
Tax History Compared to Growth
Tax History
| Year | Tax Paid | Tax Assessment Tax Assessment Total Assessment is a certain percentage of the fair market value that is determined by local assessors to be the total taxable value of land and additions on the property. | Land | Improvement |
|---|---|---|---|---|
| 2024 | $5,517 | $90,157 | $22,115 | $68,042 |
| 2023 | $5,324 | $82,880 | $20,330 | $62,550 |
| 2022 | $5,036 | $79,240 | $19,440 | $59,800 |
| 2021 | $4,623 | $78,340 | $19,220 | $59,120 |
| 2020 | $4,552 | $76,790 | $18,840 | $57,950 |
| 2019 | $4,410 | $73,680 | $18,080 | $55,600 |
| 2018 | $4,515 | $74,050 | $18,170 | $55,880 |
| 2017 | $4,363 | $71,250 | $17,480 | $53,770 |
| 2016 | $4,168 | $68,000 | $16,680 | $51,320 |
| 2015 | $4,119 | $63,970 | $15,690 | $48,280 |
| 2014 | $4,136 | $63,460 | $15,560 | $47,900 |
| 2013 | $4,187 | $63,170 | $15,490 | $47,680 |
Source: Public Records
Map
Nearby Homes
- 2667 Woodmere Dr Unit 44
- 2611 Woodmere Dr Unit 24
- 7911 Hedgewood Dr
- 2714 Whitlock Dr
- 8250 Lemont Rd
- 8240 Lemont Rd
- 2417 Green Valley Rd
- 1340 83rd St
- 8269 Meadowwood Ave
- 1133 Central Ave
- 7925 Fairmount Ave
- 960 86th St
- 7625 Dunham Rd
- 7517 Main St
- 7769 Danbury Dr
- 7930 Woodglen Ln Unit 204
- 8000 Woodglen Ln Unit 101
- 7501 Cambridge Rd
- 8100 Woodglen Ln Unit 204
- 8620 Washington St
- 2707 Curran Ct Unit 128
- 2701 Curran Ct Unit 125
- 2703 Curran Ct Unit 126
- 2715 Curran Ct Unit 131
- 2717 Curran Ct Unit 132
- 2713 Curran Ct Unit 130
- 2711 Curran Ct Unit 129
- 2665 Woodmere Dr Unit 43
- 2663 Woodmere Dr Unit 42
- 2661 Woodmere Dr Unit 41
- 2653 Woodmere Dr Unit 38
- 2657 Woodmere Dr Unit 40
- 2655 Woodmere Dr Unit 39
- 2651 Woodmere Dr Unit 37
- 2655 Woodmere Dr Unit 2655
- 2727 Curran Ct Unit 133
- 2727 Curran Ct Unit 1
- 2725 Curran Ct Unit 134
- 2723 Curran Ct Unit 135
- 2731 Curran Ct Unit 141