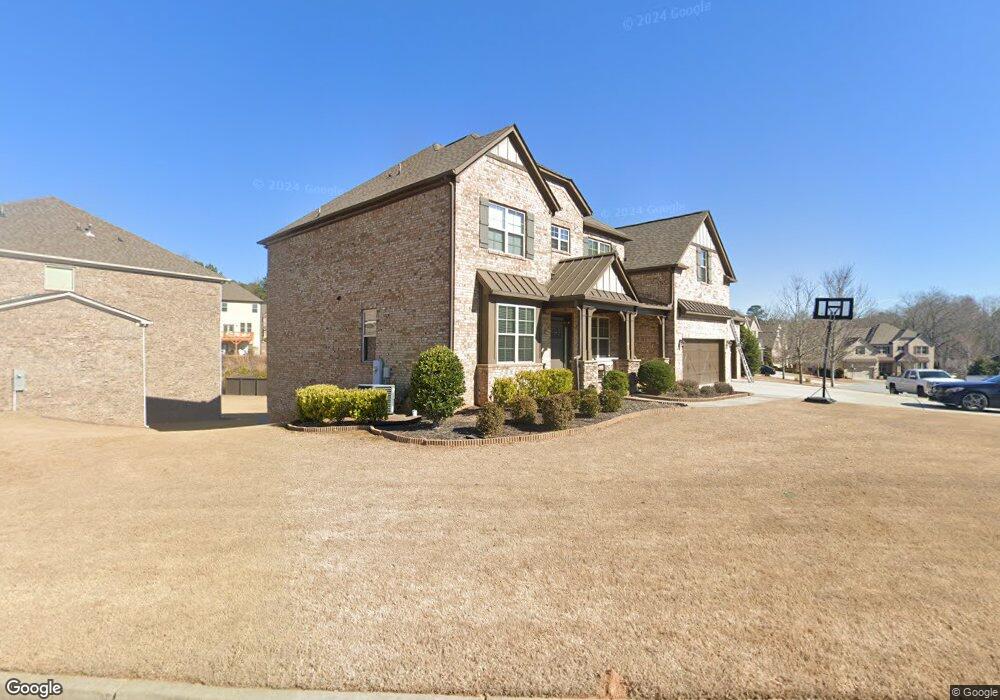
2705 Fox Hunt Way Cumming, GA 30041
Estimated Value: $841,000 - $900,000
5
Beds
4
Baths
4,184
Sq Ft
$209/Sq Ft
Est. Value
About This Home
This home is located at 2705 Fox Hunt Way, Cumming, GA 30041 and is currently estimated at $876,488, approximately $209 per square foot. 2705 Fox Hunt Way is a home with nearby schools including Haw Creek Elementary School, Lakeside Middle School, and South Forsyth High School.
Ownership History
Date
Name
Owned For
Owner Type
Purchase Details
Closed on
Aug 29, 2025
Sold by
Shah Prashant and Shah Jyoti
Bought by
Patel Miteshkumar Pravinbhai and Patel Jigishaben Miteshkumar
Current Estimated Value
Home Financials for this Owner
Home Financials are based on the most recent Mortgage that was taken out on this home.
Original Mortgage
$464,750
Outstanding Balance
$464,750
Interest Rate
5.87%
Mortgage Type
New Conventional
Estimated Equity
$411,738
Purchase Details
Closed on
Jan 15, 2016
Sold by
Beazer Homes Corp
Bought by
Shah Prashant and Shah Jyoti
Home Financials for this Owner
Home Financials are based on the most recent Mortgage that was taken out on this home.
Original Mortgage
$417,112
Interest Rate
3.99%
Mortgage Type
New Conventional
Create a Home Valuation Report for This Property
The Home Valuation Report is an in-depth analysis detailing your home's value as well as a comparison with similar homes in the area
Home Values in the Area
Average Home Value in this Area
Purchase History
| Date | Buyer | Sale Price | Title Company |
|---|---|---|---|
| Patel Miteshkumar Pravinbhai | $845,000 | None Listed On Document | |
| Patel Miteshkumar Pravinbhai | $845,000 | None Listed On Document | |
| Shah Prashant | $521,390 | -- |
Source: Public Records
Mortgage History
| Date | Status | Borrower | Loan Amount |
|---|---|---|---|
| Open | Patel Miteshkumar Pravinbhai | $464,750 | |
| Closed | Patel Miteshkumar Pravinbhai | $464,750 | |
| Previous Owner | Shah Prashant | $417,112 |
Source: Public Records
Tax History Compared to Growth
Tax History
| Year | Tax Paid | Tax Assessment Tax Assessment Total Assessment is a certain percentage of the fair market value that is determined by local assessors to be the total taxable value of land and additions on the property. | Land | Improvement |
|---|---|---|---|---|
| 2025 | $7,660 | $334,112 | $80,000 | $254,112 |
| 2024 | $7,660 | $312,384 | $68,000 | $244,384 |
| 2023 | $7,483 | $303,996 | $54,000 | $249,996 |
| 2022 | $6,365 | $208,036 | $40,000 | $168,036 |
| 2021 | $5,745 | $208,036 | $40,000 | $168,036 |
| 2020 | $6,010 | $217,628 | $40,000 | $177,628 |
| 2019 | $5,887 | $212,896 | $40,000 | $172,896 |
| 2018 | $5,600 | $202,496 | $32,000 | $170,496 |
| 2017 | $5,497 | $198,044 | $32,000 | $166,044 |
| 2016 | $5,497 | $198,044 | $32,000 | $166,044 |
| 2015 | $723 | $32,000 | $26,000 | $0 |
Source: Public Records
Map
Nearby Homes
- Manchester Plan at The Glade
- Belville Plan at The Glade
- Milton Plan at The Glade
- 2410 Overpass
- 2640 Blackstock Dr
- 2625 Blackstock Dr
- 2216 Trammel Rd
- 5613 Lancashire Ln
- 5349 Davenport Manor
- 5303 Davenport Manor
- 2350 Gladstone Place
- 2390 Colchester Ct
- 7029 Bennington Ln
- 2945 Links View Way
- 5985 Marlow Dr
- 6143 Menlow Ct
- 8640 Amsbury Way
- 2400 Gants Hill Place
- 2525 Pine Slope Dr
- 0 Fox Hunt Way
- 2715 Fox Hunt Way
- 2715 Pine Slope Dr
- 2605 Alpine Terrace
- 2605 Alpine Terrace Unit 29
- 2720 Pine Slope Dr
- 2725 Fox Hunt Way
- 2515 Pine Slope Dr
- 2810 Red Rocks Trail
- 2610 Alpine Terrace
- 2540 Castlerock Ct
- 2805 Pine Slope Dr
- 2625 Alpine Terrace
- 2550 Castlerock Ct
- 2560 Castlerock Ct
- 2820 Red Rocks Trail
- 2720 Fox Hunt Way
- 2620 Alpine Terrace
- 2735 Fox Hunt Way