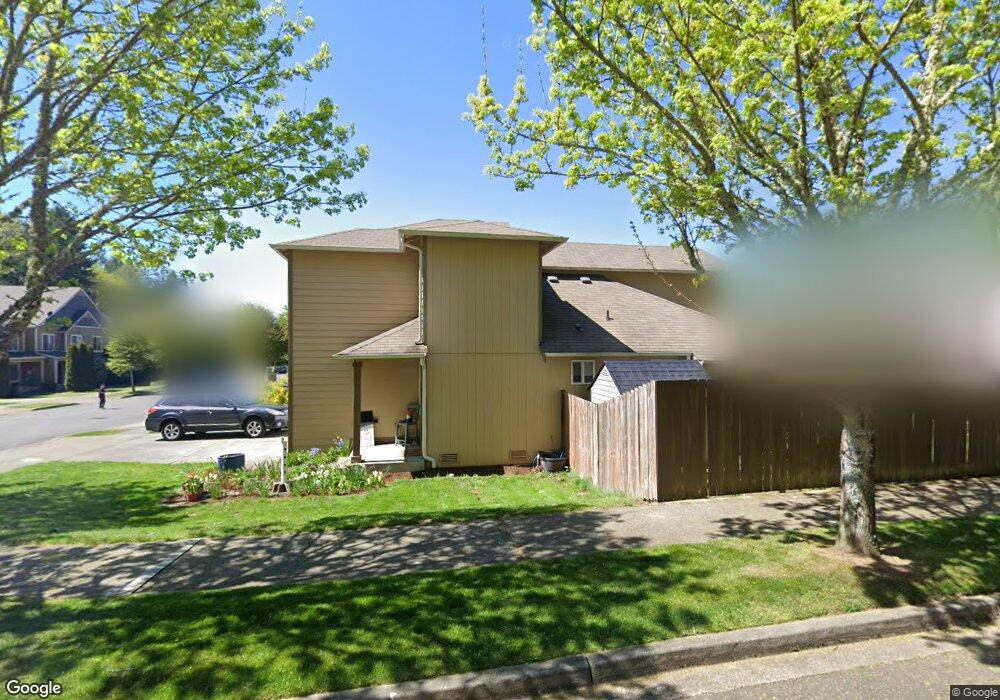
2705 Hidden Springs Loop SE Lacey, WA 98503
The Lakes NeighborhoodEstimated Value: $478,704 - $513,000
3
Beds
3
Baths
1,640
Sq Ft
$303/Sq Ft
Est. Value
About This Home
This home is located at 2705 Hidden Springs Loop SE, Lacey, WA 98503 and is currently estimated at $496,676, approximately $302 per square foot. 2705 Hidden Springs Loop SE is a home located in Thurston County with nearby schools including Seven Oaks Elementary School, Nisqually Middle School, and River Ridge High School.
Ownership History
Date
Name
Owned For
Owner Type
Purchase Details
Closed on
Jul 18, 2011
Sold by
Hull Richard F
Bought by
Viehweg Joshua J and Viehweg Dominique L
Current Estimated Value
Home Financials for this Owner
Home Financials are based on the most recent Mortgage that was taken out on this home.
Original Mortgage
$181,771
Outstanding Balance
$124,994
Interest Rate
4.5%
Mortgage Type
FHA
Estimated Equity
$371,682
Purchase Details
Closed on
Apr 26, 2005
Sold by
Mccoy James G and Anderson Patricia M
Bought by
Hull Richard F
Home Financials for this Owner
Home Financials are based on the most recent Mortgage that was taken out on this home.
Original Mortgage
$146,000
Interest Rate
5.99%
Mortgage Type
Fannie Mae Freddie Mac
Purchase Details
Closed on
Apr 7, 2005
Sold by
Freestone Dff Lancaster Llc
Bought by
Mccoy James G and Anderson Patricia M
Home Financials for this Owner
Home Financials are based on the most recent Mortgage that was taken out on this home.
Original Mortgage
$146,000
Interest Rate
5.99%
Mortgage Type
Fannie Mae Freddie Mac
Create a Home Valuation Report for This Property
The Home Valuation Report is an in-depth analysis detailing your home's value as well as a comparison with similar homes in the area
Home Values in the Area
Average Home Value in this Area
Purchase History
| Date | Buyer | Sale Price | Title Company |
|---|---|---|---|
| Viehweg Joshua J | $186,500 | First American Title | |
| Hull Richard F | $182,500 | Chicago Title Co | |
| Mccoy James G | $161,400 | Chicago Title Co |
Source: Public Records
Mortgage History
| Date | Status | Borrower | Loan Amount |
|---|---|---|---|
| Open | Viehweg Joshua J | $181,771 | |
| Previous Owner | Hull Richard F | $146,000 |
Source: Public Records
Tax History Compared to Growth
Tax History
| Year | Tax Paid | Tax Assessment Tax Assessment Total Assessment is a certain percentage of the fair market value that is determined by local assessors to be the total taxable value of land and additions on the property. | Land | Improvement |
|---|---|---|---|---|
| 2024 | $3,917 | $416,600 | $118,400 | $298,200 |
| 2023 | $3,917 | $399,100 | $98,700 | $300,400 |
| 2022 | $3,756 | $376,800 | $60,000 | $316,800 |
| 2021 | $3,387 | $313,500 | $66,200 | $247,300 |
| 2020 | $3,136 | $262,900 | $65,300 | $197,600 |
| 2019 | $2,641 | $250,200 | $59,500 | $190,700 |
| 2018 | $2,976 | $212,000 | $44,400 | $167,600 |
| 2017 | $2,794 | $207,150 | $43,350 | $163,800 |
| 2016 | $2,577 | $194,950 | $42,550 | $152,400 |
| 2014 | -- | $187,450 | $42,550 | $144,900 |
Source: Public Records
Map
Nearby Homes
- 2538 Hidden Springs Loop SE
- 2544 Marvin Rd SE
- 2602 Marvin Rd SE
- 7806 24th Ct SE
- 7735 22nd Ln SE
- 2109 Ava St SE
- 1823 Cranberry Ln SE
- 7819 19th Ln SE
- 3110 Long Lake Dr SE
- 8124 18th Ln SE Unit 142
- 8348 Abington Loop SE
- 2312 Carnbee Ct SE
- 8220 Lake Forest Dr SE
- 8235 Sweetbrier Loop SE
- 8320 16th Ave SE
- 3607 Walthew Dr SE
- 3901 Long Lake Dr SE
- 7240 Holmes Island Rd SE
- 8711 Fenwick Loop SE
- 3300 Carpenter Rd SE Unit 100
- 2713 Hidden Springs Loop SE
- 8113 27th Ave SE
- 2721 Hidden Springs Loop SE
- 2708 Hidden Springs Loop SE
- 2706 Hidden Springs Loop SE
- 2710 Hidden Springs Loop SE
- 2704 Hidden Springs Loop SE
- 2700 Hidden Springs Loop SE
- 2702 Hidden Springs Loop SE
- 8101 27th Ave SE
- 2723 Hidden Springs Loop SE
- 2714 Hidden Springs Loop SE
- 2716 Hidden Springs Loop SE
- 8045 27th Ave SE
- 2718 Hidden Springs Loop SE
- 2727 Hidden Springs Loop SE
- 2720 Hidden Springs Loop SE
- 8122 27th Ave SE
- 2644 Hidden Springs Loop SE
- 8118 27th Ave SE