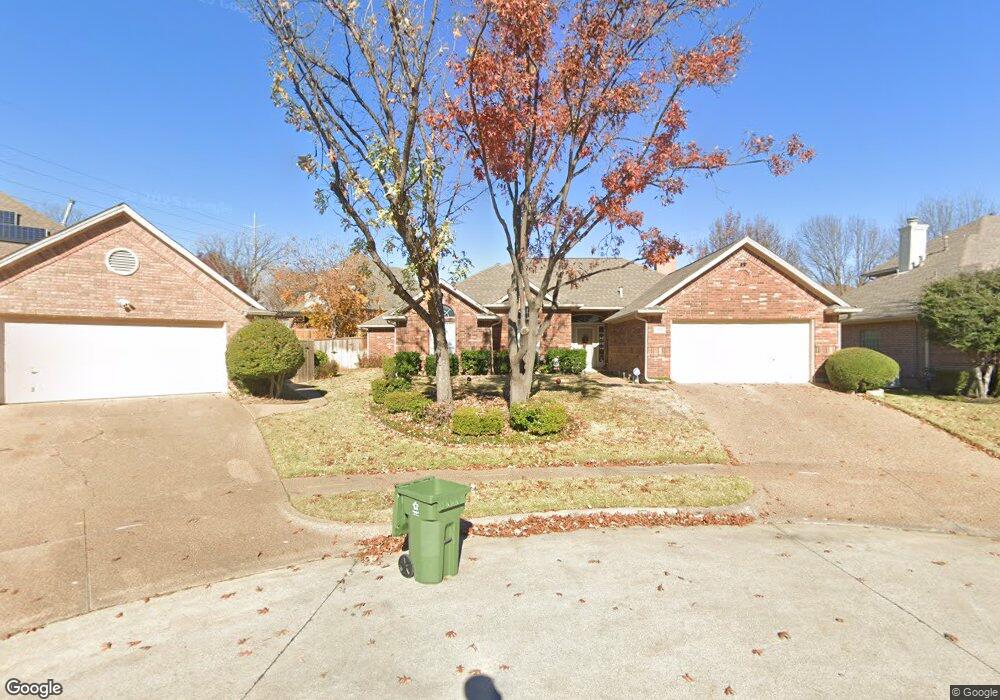
2705 Maple Brook Ct Bedford, TX 76021
Estimated Value: $423,492 - $496,000
4
Beds
2
Baths
1,960
Sq Ft
$235/Sq Ft
Est. Value
About This Home
This home is located at 2705 Maple Brook Ct, Bedford, TX 76021 and is currently estimated at $460,373, approximately $234 per square foot. 2705 Maple Brook Ct is a home located in Tarrant County with nearby schools including Meadow Creek Elementary School, Harwood Junior High School, and Trinity High School.
Ownership History
Date
Name
Owned For
Owner Type
Purchase Details
Closed on
Apr 21, 2021
Sold by
Shaw Barbara Ann
Bought by
Shaw Barbara A and Shaw Living Trust
Current Estimated Value
Purchase Details
Closed on
Sep 2, 2003
Sold by
Pakis David W
Bought by
Shaw Barbara Ann
Home Financials for this Owner
Home Financials are based on the most recent Mortgage that was taken out on this home.
Original Mortgage
$70,000
Interest Rate
5.87%
Mortgage Type
Purchase Money Mortgage
Purchase Details
Closed on
Jul 8, 1999
Sold by
Grossman Kenneth L and Grossman Cindy K
Bought by
Pakis David W
Purchase Details
Closed on
Mar 31, 1994
Sold by
Anderson Kenneth L and Smith Billy M
Bought by
Grossman Kenneth L and Grossman Cindy K
Home Financials for this Owner
Home Financials are based on the most recent Mortgage that was taken out on this home.
Original Mortgage
$110,800
Interest Rate
7.5%
Create a Home Valuation Report for This Property
The Home Valuation Report is an in-depth analysis detailing your home's value as well as a comparison with similar homes in the area
Home Values in the Area
Average Home Value in this Area
Purchase History
| Date | Buyer | Sale Price | Title Company |
|---|---|---|---|
| Shaw Barbara A | -- | None Available | |
| Shaw Barbara Ann | -- | -- | |
| Pakis David W | -- | Alamo Title Company | |
| Grossman Kenneth L | -- | Lawyers American Title Co |
Source: Public Records
Mortgage History
| Date | Status | Borrower | Loan Amount |
|---|---|---|---|
| Closed | Shaw Barbara Ann | $70,000 | |
| Previous Owner | Grossman Kenneth L | $110,800 |
Source: Public Records
Tax History Compared to Growth
Tax History
| Year | Tax Paid | Tax Assessment Tax Assessment Total Assessment is a certain percentage of the fair market value that is determined by local assessors to be the total taxable value of land and additions on the property. | Land | Improvement |
|---|---|---|---|---|
| 2025 | $2,265 | $343,081 | $100,000 | $243,081 |
| 2024 | $2,265 | $429,032 | $100,000 | $329,032 |
| 2023 | $7,458 | $414,412 | $70,000 | $344,412 |
| 2022 | $7,721 | $353,490 | $70,000 | $283,490 |
| 2021 | $7,608 | $322,965 | $70,000 | $252,965 |
| 2020 | $7,202 | $302,892 | $70,000 | $232,892 |
| 2019 | $7,115 | $292,868 | $70,000 | $222,868 |
| 2018 | $3,880 | $283,336 | $70,000 | $213,336 |
| 2017 | $6,351 | $262,550 | $45,000 | $217,550 |
| 2016 | $5,898 | $246,093 | $45,000 | $201,093 |
| 2015 | $3,836 | $251,921 | $45,000 | $206,921 |
| 2014 | $3,836 | $201,500 | $30,000 | $171,500 |
Source: Public Records
Map
Nearby Homes
- 2700 Mimosa Ct
- 2609 Woodson Dr
- 2601 Murphy Dr
- 2516 Classic Ct W
- 2521 Sanders Ct
- 2501 Murphy Dr
- 2616 Greenwood Ct
- 2522 Durango Ridge Dr
- 2709 Willow Bend
- 3024 Highgate Ln
- 2922 Beachtree Ln
- 2600 Willow Bend
- 2300 Folkstone Way
- 2417 Meadow Ct
- 2909 Oakridge Dr
- 3100 Emerald St
- 3104 Emerald St
- 3205 Princess St
- 2220 Tiffany Glenn Ct
- 2202 Sandshell St
- 2709 Maple Brook Ct
- 2701 Maple Brook Ct
- 2708 Mimosa Ct
- 2704 Mimosa Ct
- 2713 Maple Brook Ct
- 2712 Mimosa Ct
- 2700 Maple Brook Ct
- 2716 Mimosa Ct
- 2708 Maple Brook Ct
- 2717 Maple Brook Ct
- 2712 Maple Brook Ct
- 2704 Maple Brook Ct
- 2716 Maple Brook Ct
- 2720 Mimosa Ct
- 2701 Mimosa Ct
- 2709 Mimosa Ct
- 2705 Mimosa Ct
- 2720 Maple Brook Ct
- 2713 Mimosa Ct
- 2724 Mimosa Ct