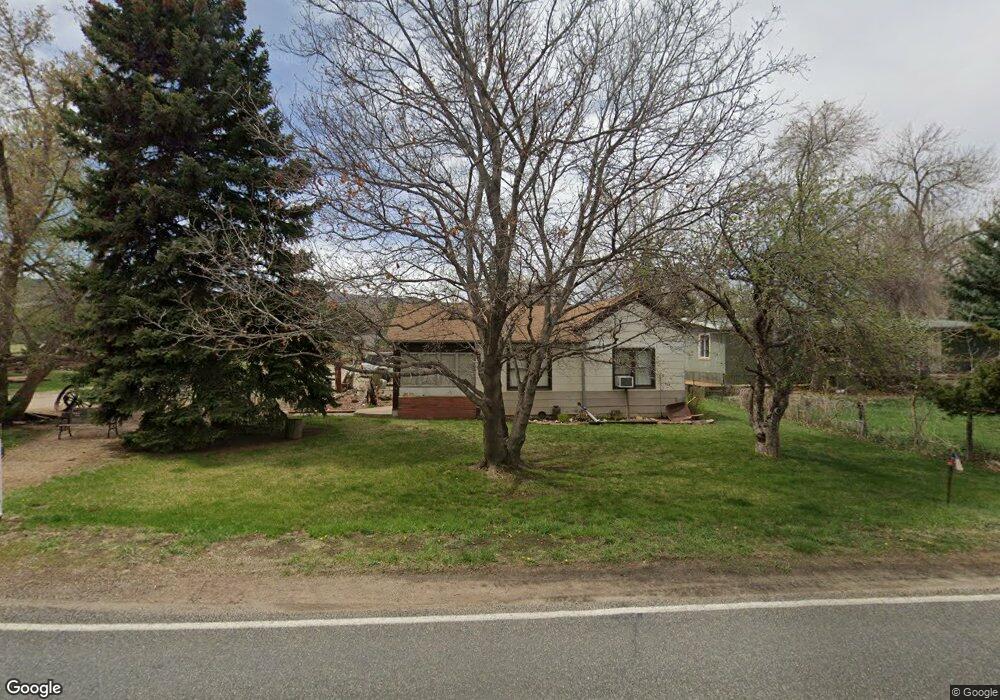
2705 N County Road 23 Bellvue, CO 80512
Estimated Value: $460,830 - $1,137,000
2
Beds
3
Baths
1,466
Sq Ft
$489/Sq Ft
Est. Value
About This Home
This home is located at 2705 N County Road 23, Bellvue, CO 80512 and is currently estimated at $717,458, approximately $489 per square foot. 2705 N County Road 23 is a home located in Larimer County with nearby schools including Cache La Poudre Elementary School, Cache La Poudre Middle School, and Poudre High School.
Ownership History
Date
Name
Owned For
Owner Type
Purchase Details
Closed on
Oct 23, 2025
Sold by
Joseph Sandra K
Bought by
1920 Spragg Llc
Current Estimated Value
Purchase Details
Closed on
Sep 28, 2020
Sold by
Allbrandt Myrna N and Estate Of Eddie Lee Allbrandt
Bought by
Zeigler Debra A and Darlene R Armstadt Fam Second
Purchase Details
Closed on
Sep 23, 2020
Sold by
Washburn Arland E
Bought by
Allbrandt Rick
Purchase Details
Closed on
Sep 22, 2020
Sold by
Dalrene R Arnstad Family Irrevocable Tr
Bought by
He Darlene R Arnstad Second Fam Irrevoca
Purchase Details
Closed on
Aug 9, 2018
Sold by
Arnstad Darlene R
Bought by
The Darlene R Arnstad Family Irrevocable
Purchase Details
Closed on
Jul 23, 2018
Sold by
Washburn Arland E and Estate Of Delores F Washburn
Bought by
Washburn Arland E
Purchase Details
Closed on
May 1, 1986
Bought by
Arnstad Darlene and Arnstad Washburn
Create a Home Valuation Report for This Property
The Home Valuation Report is an in-depth analysis detailing your home's value as well as a comparison with similar homes in the area
Home Values in the Area
Average Home Value in this Area
Purchase History
| Date | Buyer | Sale Price | Title Company |
|---|---|---|---|
| 1920 Spragg Llc | -- | None Listed On Document | |
| 1920 Spragg Llc | -- | None Listed On Document | |
| 1920 Spragg Llc | -- | None Listed On Document | |
| 1920 Spragg Llc | -- | None Listed On Document | |
| Zeigler Debra A | -- | None Listed On Document | |
| Zeigler Debra A | -- | None Available | |
| Allbrandt Rick | -- | None Available | |
| He Darlene R Arnstad Second Fam Irrevoca | -- | None Available | |
| The Darlene R Arnstad Family Irrevocable | -- | None Available | |
| Washburn Arland E | -- | None Available | |
| Arnstad Darlene | -- | -- |
Source: Public Records
Tax History Compared to Growth
Tax History
| Year | Tax Paid | Tax Assessment Tax Assessment Total Assessment is a certain percentage of the fair market value that is determined by local assessors to be the total taxable value of land and additions on the property. | Land | Improvement |
|---|---|---|---|---|
| 2025 | $1,592 | $26,760 | $2,412 | $24,348 |
| 2024 | $1,515 | $26,760 | $2,412 | $24,348 |
| 2022 | $1,526 | $22,942 | $2,502 | $20,440 |
| 2021 | $1,540 | $23,602 | $2,574 | $21,028 |
| 2020 | $2,417 | $25,604 | $2,574 | $23,030 |
| 2019 | $2,428 | $25,604 | $2,574 | $23,030 |
| 2018 | $2,243 | $24,394 | $2,592 | $21,802 |
| 2017 | $2,235 | $24,394 | $2,592 | $21,802 |
| 2016 | $1,503 | $16,318 | $2,866 | $13,452 |
| 2015 | $1,492 | $17,400 | $2,870 | $14,530 |
| 2014 | $1,504 | $16,340 | $2,870 | $13,470 |
Source: Public Records
Map
Nearby Homes
- 2720 N County Road 23
- 3501 Raptor Ridge Ln
- 4516 Bingham Hill Rd
- 2921 Lochlomond Dr
- 4520 W County Road 54g
- 3328 Mcconnell Dr
- 4516 Del Colina Way
- 4442 Del Colina Way
- 3405 Post Rd
- 3308 Innisfree Ln
- 2833 N Overland Trail
- 2824 N Overland Trail
- 2816 W County Road 54g
- 1521 Station Ct
- 6508 Jackpine Dr
- 898 Hernia Hill Trail
- 1361 Bubbling Brook Ct
- 1362 Bubbling Brook Ct
- 100 Canyon Gulch Rd
- 2801 Farview Dr
- 2709 N County Road 23
- 33032 W 78336 Us Hwy 40 #B3 Hwy
- 2716 N County Road 23
- 2713 N County Road 23
- 2708 2nd St
- 2704 2nd St
- 2700 N County Road 23
- 5101 Grizzly St
- 2704 N County Road 23
- 2721 N County Road 23
- 2716 2nd St
- 1223 Old School Rd
- 5129 County Road 50c
- 2805 N County Road 23
- 2724 N County Road 23
- 2809 N County Road 23
- 2825 N County Road 23
- 2829 N County Road 23
- 5103 Laporte St
- 2828 2nd St