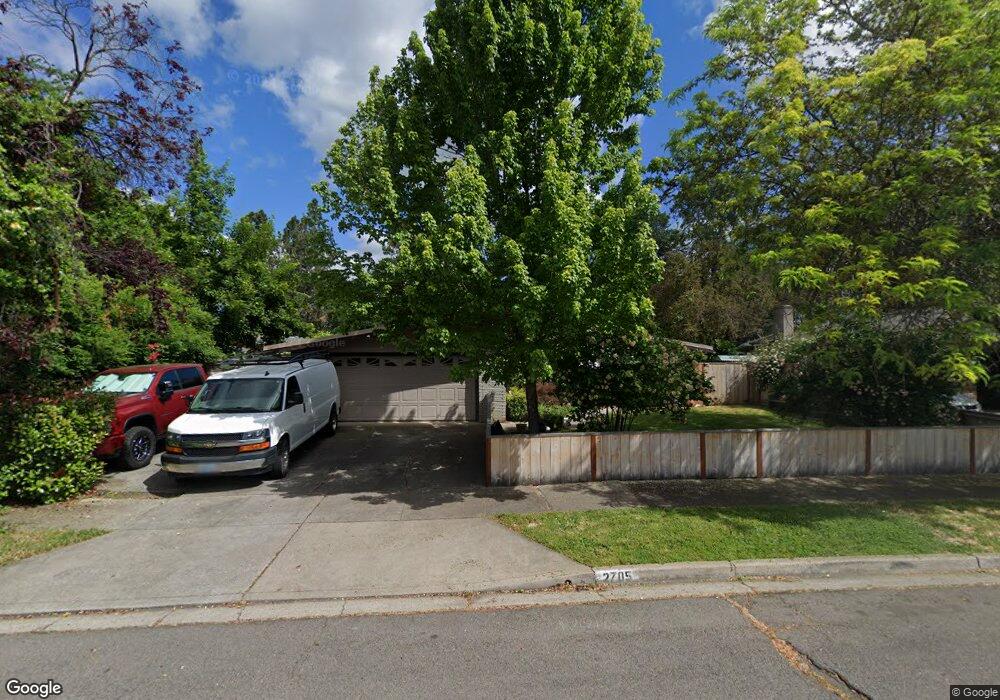
2705 Randolph St Medford, OR 97504
Estimated Value: $374,000 - $423,000
4
Beds
2
Baths
1,537
Sq Ft
$257/Sq Ft
Est. Value
About This Home
This home is located at 2705 Randolph St, Medford, OR 97504 and is currently estimated at $395,532, approximately $257 per square foot. 2705 Randolph St is a home located in Jackson County with nearby schools including Orchard Hill Elementary School, Talent Middle School, and Phoenix High School.
Ownership History
Date
Name
Owned For
Owner Type
Purchase Details
Closed on
Oct 25, 2018
Sold by
Laughery Ronald and Laughery Cynthia
Bought by
Laughery Ronald Dierk and Laughery April E
Current Estimated Value
Home Financials for this Owner
Home Financials are based on the most recent Mortgage that was taken out on this home.
Original Mortgage
$122,500
Outstanding Balance
$110,042
Interest Rate
5.93%
Mortgage Type
Adjustable Rate Mortgage/ARM
Estimated Equity
$285,490
Purchase Details
Closed on
Nov 23, 2004
Sold by
Sayre Mary Jean D
Bought by
Laughery Ronald and Laughery Cynthia
Home Financials for this Owner
Home Financials are based on the most recent Mortgage that was taken out on this home.
Original Mortgage
$170,400
Interest Rate
5.72%
Mortgage Type
Unknown
Create a Home Valuation Report for This Property
The Home Valuation Report is an in-depth analysis detailing your home's value as well as a comparison with similar homes in the area
Home Values in the Area
Average Home Value in this Area
Purchase History
| Date | Buyer | Sale Price | Title Company |
|---|---|---|---|
| Laughery Ronald Dierk | $200,000 | First American Title | |
| Laughery Ronald | $213,000 | First American Title Insuran |
Source: Public Records
Mortgage History
| Date | Status | Borrower | Loan Amount |
|---|---|---|---|
| Open | Laughery Ronald Dierk | $122,500 | |
| Previous Owner | Laughery Ronald | $170,400 | |
| Closed | Laughery Ronald | $31,950 |
Source: Public Records
Tax History Compared to Growth
Tax History
| Year | Tax Paid | Tax Assessment Tax Assessment Total Assessment is a certain percentage of the fair market value that is determined by local assessors to be the total taxable value of land and additions on the property. | Land | Improvement |
|---|---|---|---|---|
| 2025 | $2,876 | $197,910 | $85,240 | $112,670 |
| 2024 | $2,876 | $192,150 | $82,760 | $109,390 |
| 2023 | $2,785 | $186,560 | $80,350 | $106,210 |
| 2022 | $2,712 | $186,560 | $80,350 | $106,210 |
| 2021 | $2,649 | $181,130 | $78,010 | $103,120 |
| 2020 | $2,574 | $175,860 | $75,740 | $100,120 |
| 2019 | $2,506 | $165,770 | $71,390 | $94,380 |
| 2018 | $2,433 | $160,950 | $69,310 | $91,640 |
| 2017 | $2,293 | $160,950 | $69,310 | $91,640 |
| 2016 | $2,297 | $151,720 | $65,320 | $86,400 |
| 2015 | $2,209 | $151,720 | $54,060 | $97,660 |
| 2014 | $2,123 | $143,020 | $50,960 | $92,060 |
Source: Public Records
Map
Nearby Homes
- 908 Black Oak Dr
- 2741 Ruth Dr
- 2549 E Barnett Rd
- 2566 Heritage Way
- 2462 Senate Way
- 826 Morrison Ave
- 872 Morrison Ave
- 543 Hoover Park Dr
- 1300 E Barnett Rd
- 3595 E Barnett Rd
- 881 Olympic Ave
- 2556 Dellwood Ave
- 3122 Alameda St
- 3126 Alameda St Unit 315
- 3126 Alameda St Unit 320
- 425 S Modoc Ave
- 755 Ellendale Dr
- 349 Tan Oak Dr
- 325 Sutter Ave
- 754 Fernwood Dr
- 2715 Randolph St
- 815 Black Oak Dr
- 809 Black Oak Dr
- 2700 Randolph St
- 2710 Randolph St
- 2735 Randolph St
- 2720 Randolph St
- 2730 Randolph St
- 2700 E Barnett Rd Unit 701
- 2700 E Barnett Rd Unit 751
- 2700 E Barnett Rd Unit B
- 2740 Randolph St
- 2709 Lawrence Ave
- 2701 Lawrence Ave
- 2725 Lawrence Ave
- 2755 Randolph St
- 2750 Randolph St
- 2630 E Barnett Rd
- 2733 Lawrence Ave