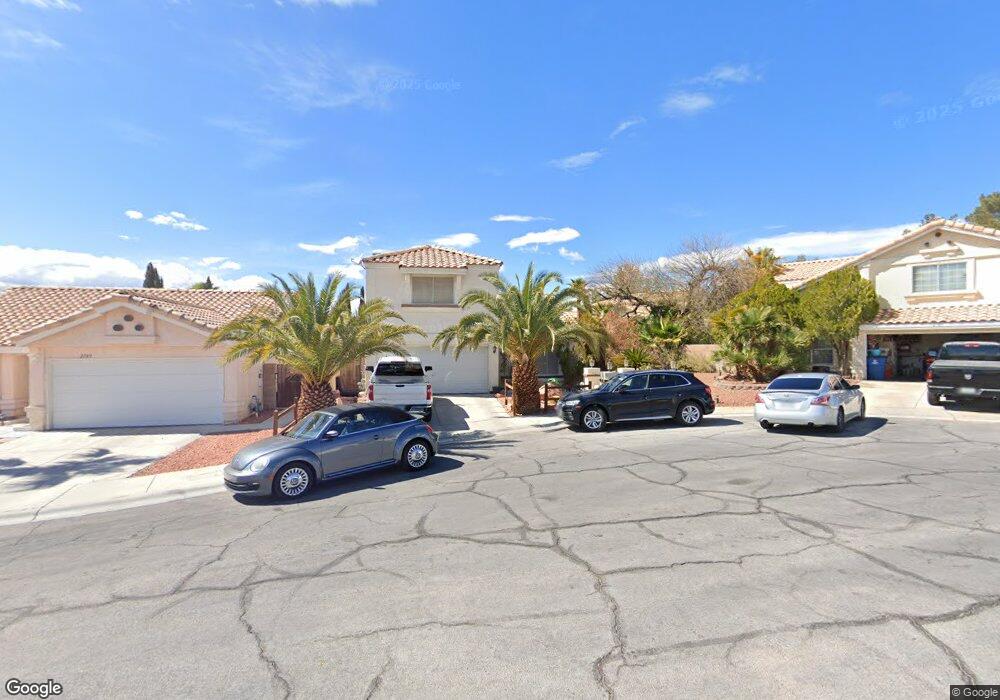
2705 Snow Cap Cir Unit 9A Las Vegas, NV 89117
The Section Seven NeighborhoodEstimated Value: $443,279 - $494,000
3
Beds
3
Baths
1,701
Sq Ft
$278/Sq Ft
Est. Value
About This Home
This home is located at 2705 Snow Cap Cir Unit 9A, Las Vegas, NV 89117 and is currently estimated at $472,320, approximately $277 per square foot. 2705 Snow Cap Cir Unit 9A is a home located in Clark County with nearby schools including M J Christensen Elementary School, Clifford J Lawrence Junior High School, and Bonanza High School.
Ownership History
Date
Name
Owned For
Owner Type
Purchase Details
Closed on
Oct 6, 2015
Sold by
Lenhart Paul S
Bought by
Lenhart Michael S and Paul S Lenhart Real Property Trust
Current Estimated Value
Purchase Details
Closed on
Jan 29, 2015
Sold by
Lenhart Paul S
Bought by
Lenhart Paul S and Lenhart Michael Shane
Purchase Details
Closed on
Oct 9, 2002
Sold by
Buckbee Larry D and Buckbee Almira E
Bought by
Lenhart Paul S and Lenhart Cecilia V
Home Financials for this Owner
Home Financials are based on the most recent Mortgage that was taken out on this home.
Original Mortgage
$70,000
Outstanding Balance
$29,368
Interest Rate
6.17%
Estimated Equity
$442,952
Purchase Details
Closed on
Jul 8, 1999
Sold by
Krute Robert D
Bought by
Buckbee Larry D and Buckbee Almira E
Home Financials for this Owner
Home Financials are based on the most recent Mortgage that was taken out on this home.
Original Mortgage
$94,500
Interest Rate
7.4%
Create a Home Valuation Report for This Property
The Home Valuation Report is an in-depth analysis detailing your home's value as well as a comparison with similar homes in the area
Home Values in the Area
Average Home Value in this Area
Purchase History
| Date | Buyer | Sale Price | Title Company |
|---|---|---|---|
| Lenhart Michael S | -- | None Available | |
| Lenhart Paul S | -- | None Available | |
| Lenhart Paul S | -- | None Available | |
| Lenhart Paul S | $170,000 | Lawyers Title | |
| Buckbee Larry D | $135,000 | United Title |
Source: Public Records
Mortgage History
| Date | Status | Borrower | Loan Amount |
|---|---|---|---|
| Open | Lenhart Paul S | $70,000 | |
| Previous Owner | Buckbee Larry D | $94,500 |
Source: Public Records
Tax History Compared to Growth
Tax History
| Year | Tax Paid | Tax Assessment Tax Assessment Total Assessment is a certain percentage of the fair market value that is determined by local assessors to be the total taxable value of land and additions on the property. | Land | Improvement |
|---|---|---|---|---|
| 2025 | $2,010 | $83,245 | $37,100 | $46,145 |
| 2024 | $857 | $83,245 | $37,100 | $46,145 |
| 2023 | $857 | $82,900 | $38,500 | $44,400 |
| 2022 | $1,450 | $70,831 | $29,750 | $41,081 |
| 2021 | $1,924 | $66,753 | $27,300 | $39,453 |
| 2020 | $1,364 | $64,973 | $25,550 | $39,423 |
| 2019 | $1,082 | $64,634 | $25,603 | $39,031 |
| 2018 | $1,595 | $62,966 | $25,270 | $37,696 |
| 2017 | $2,036 | $62,098 | $23,608 | $38,490 |
| 2016 | $1,101 | $55,470 | $16,625 | $38,845 |
| 2015 | $1,110 | $48,771 | $15,628 | $33,143 |
| 2014 | $1,214 | $42,726 | $8,313 | $34,413 |
Source: Public Records
Map
Nearby Homes
- 9544 Lazy River Dr
- 2724 Monrovia Dr
- 2728 Monrovia Dr
- 2712 Quail Roost Way
- 9429 Abalone Way
- 2729 Beachside Ct
- 9708 Blazing Star Ct
- 2300 Storkspur Way
- 2913 Domino Way
- 9113 Anchor Cove Ct
- 9724 Cascade Falls Ave
- 9713 Cascade Falls Ave
- 3009 Periscope Ct
- 9100 Shelter Cove Ct
- 3001 Bridge Creek St
- 2112 Preakness Pass Unit A
- 1829 Summit Pointe Dr
- 9605 Blowing Sand Cir
- 2200 S Fort Apache Rd Unit 2202
- 2200 S Fort Apache Rd Unit 1077
- 2709 Snow Cap Cir
- 2709 Snow Cap Cir
- 2709 Snow Cap Cir
- 2708 Bianca Ct
- 2701 Snow Cap Cir
- 2712 Bianca Ct Unit 9B
- 2713 Snow Cap Cir
- 2704 Bianca Ct
- 2716 Bianca Ct
- 2716 Bianca Ct Unit 9999
- 2700 Snow Cap Cir
- 2717 Snow Cap Cir
- 2712 Snow Cap Cir
- 2708 Snow Cap Cir Unit 9A
- 2720 Bianca Ct
- 2704 Snow Cap Cir
- 2716 Snow Cap Cir
- 2700 Bianca Ct
- 2720 Snow Cap Cir
- 2709 Bianca Ct