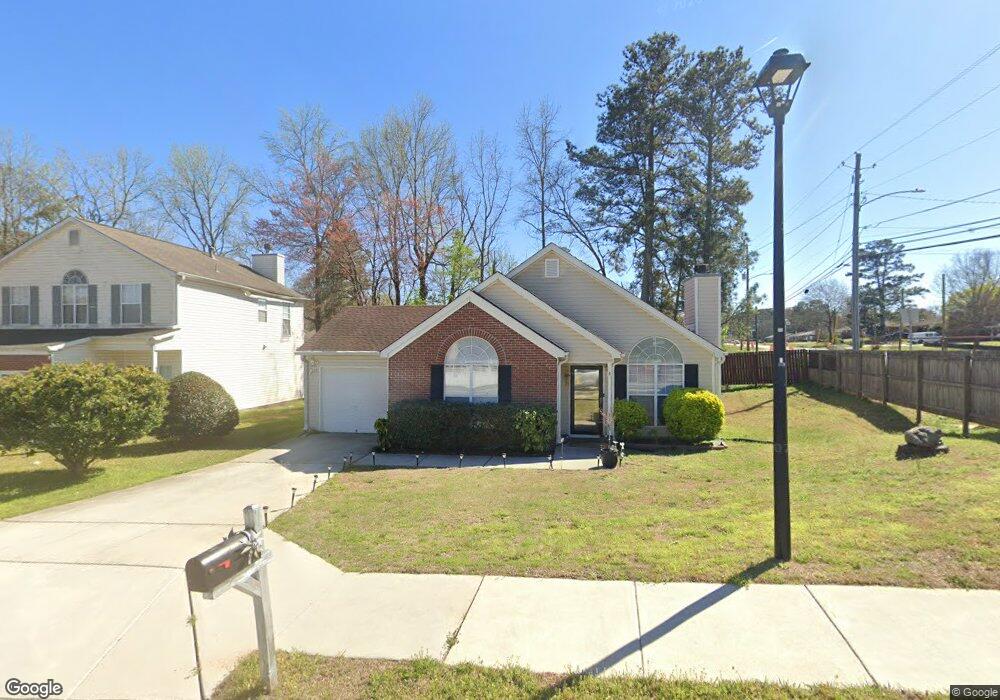
2705 Teal Landing Dr Morrow, GA 30260
Estimated Value: $217,861 - $255,000
3
Beds
2
Baths
1,366
Sq Ft
$171/Sq Ft
Est. Value
About This Home
This home is located at 2705 Teal Landing Dr, Morrow, GA 30260 and is currently estimated at $233,715, approximately $171 per square foot. 2705 Teal Landing Dr is a home located in Clayton County with nearby schools including Thurgood Marshall Elementary School, Adamson Middle School, and Morrow High School.
Ownership History
Date
Name
Owned For
Owner Type
Purchase Details
Closed on
Jun 29, 2017
Sold by
Riley Elizabeth
Bought by
Jones Daphine
Current Estimated Value
Home Financials for this Owner
Home Financials are based on the most recent Mortgage that was taken out on this home.
Original Mortgage
$108,007
Outstanding Balance
$93,423
Interest Rate
5.5%
Mortgage Type
FHA
Estimated Equity
$140,292
Purchase Details
Closed on
Apr 19, 2007
Sold by
Hud
Bought by
Riley Elizabeth
Home Financials for this Owner
Home Financials are based on the most recent Mortgage that was taken out on this home.
Original Mortgage
$101,600
Interest Rate
6.1%
Mortgage Type
New Conventional
Purchase Details
Closed on
Jul 5, 2006
Sold by
First Horizon Hm Ln Corp
Bought by
Hud
Purchase Details
Closed on
Sep 30, 1999
Sold by
Gt Architecture Contractors Corp
Bought by
Lindsey Linda
Home Financials for this Owner
Home Financials are based on the most recent Mortgage that was taken out on this home.
Original Mortgage
$99,450
Interest Rate
7.91%
Mortgage Type
FHA
Create a Home Valuation Report for This Property
The Home Valuation Report is an in-depth analysis detailing your home's value as well as a comparison with similar homes in the area
Home Values in the Area
Average Home Value in this Area
Purchase History
| Date | Buyer | Sale Price | Title Company |
|---|---|---|---|
| Jones Daphine | $110,000 | -- | |
| Riley Elizabeth | -- | -- | |
| Hud | -- | -- | |
| First Horizon Hm Ln Corp | $107,588 | -- | |
| Lindsey Linda | $100,000 | -- |
Source: Public Records
Mortgage History
| Date | Status | Borrower | Loan Amount |
|---|---|---|---|
| Open | Jones Daphine | $108,007 | |
| Previous Owner | Riley Elizabeth | $101,600 | |
| Previous Owner | Lindsey Linda | $99,450 |
Source: Public Records
Tax History Compared to Growth
Tax History
| Year | Tax Paid | Tax Assessment Tax Assessment Total Assessment is a certain percentage of the fair market value that is determined by local assessors to be the total taxable value of land and additions on the property. | Land | Improvement |
|---|---|---|---|---|
| 2024 | $2,561 | $74,680 | $7,200 | $67,480 |
| 2023 | $2,334 | $64,640 | $7,200 | $57,440 |
| 2022 | $2,058 | $61,480 | $7,200 | $54,280 |
| 2021 | $1,845 | $55,760 | $7,200 | $48,560 |
| 2020 | $1,675 | $50,933 | $7,200 | $43,733 |
| 2019 | $1,433 | $44,362 | $6,000 | $38,362 |
| 2018 | $1,412 | $43,849 | $6,000 | $37,849 |
| 2017 | $1,179 | $28,029 | $6,000 | $22,029 |
| 2016 | $1,188 | $28,266 | $6,000 | $22,266 |
| 2015 | $1,169 | $0 | $0 | $0 |
| 2014 | $1,099 | $26,688 | $6,000 | $20,688 |
Source: Public Records
Map
Nearby Homes
- 2718 Somerton Dr
- 6188 Cinnamon Ct
- 2306 Santa fe St Unit 9
- 2278 Santa fe St Unit 18
- 2280 Santa fe St Unit 17
- 2649 Lake Harbin Rd
- 2609 Lake Harbin Rd
- 6082 Kathie Ct
- 6076 Mount Zion Blvd
- 6397 E Meyer Dr
- 2731 Lynn Ct
- 6205 Fieldcrest Dr
- 6050 Randy Ln
- 2455 Lake Harbin Rd
- 2577 Castile Dr
- 6389 Warbler Ct
- 6383 Warbler Ct
- 6379 Warbler Ct
- 6387 Warbler Ct
- 6381 Warbler Ct
- 6230 Mount Zion Blvd
- 2717 Teal Landing Dr
- 6209 Cinnamon Ct
- 2710 Somerton Dr
- 2723 Teal Landing Dr
- 6201 Cinnamon Ct
- 6217 Mount Zion Blvd
- 6207 Mount Zion Blvd
- 6227 Mount Zion Blvd
- 2729 Teal Landing Dr
- 2724 Somerton Dr
- 6197 Cinnamon Ct
- 6212 Cinnamon Ct
- 6244 Mount Zion Blvd
- 6204 Cinnamon Ct
- 2735 Teal Landing Dr
- 6235 Mount Zion Blvd
- 6185 Mount Zion Blvd
- 2732 Somerton Dr Unit 1
- 2656 Lilac Dr Unit III