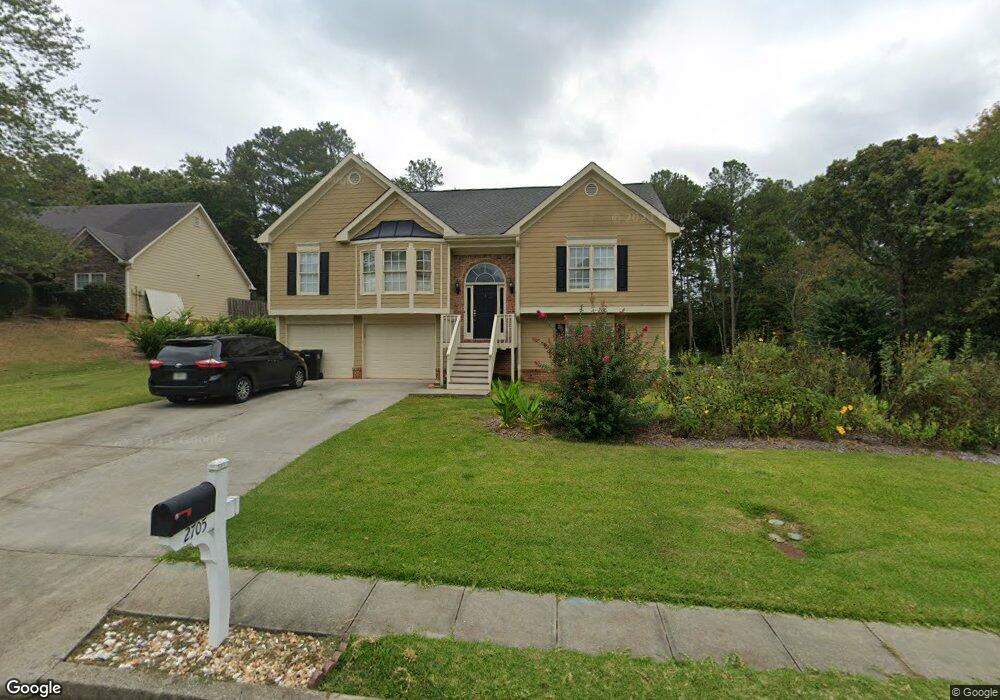
2705 Wyndham Park Dr Unit 9 Buford, GA 30519
Estimated Value: $437,000 - $473,000
4
Beds
3
Baths
2,405
Sq Ft
$188/Sq Ft
Est. Value
About This Home
This home is located at 2705 Wyndham Park Dr Unit 9, Buford, GA 30519 and is currently estimated at $451,512, approximately $187 per square foot. 2705 Wyndham Park Dr Unit 9 is a home located in Gwinnett County with nearby schools including Ivy Creek Elementary School, Glenn C. Jones Middle School, and Celebration Academy.
Ownership History
Date
Name
Owned For
Owner Type
Purchase Details
Closed on
Sep 30, 2020
Sold by
Brown William Keith
Bought by
Abert Denys
Current Estimated Value
Home Financials for this Owner
Home Financials are based on the most recent Mortgage that was taken out on this home.
Original Mortgage
$286,900
Outstanding Balance
$254,026
Interest Rate
2.9%
Mortgage Type
New Conventional
Estimated Equity
$197,486
Purchase Details
Closed on
May 27, 1999
Sold by
Pruitt Harvey E and Pruitt Mary E
Bought by
Brown William K and Brown Janet D
Home Financials for this Owner
Home Financials are based on the most recent Mortgage that was taken out on this home.
Original Mortgage
$152,700
Interest Rate
6.84%
Mortgage Type
FHA
Purchase Details
Closed on
May 19, 1997
Sold by
Dms Builders Inc
Bought by
Pruitt Harvey E
Home Financials for this Owner
Home Financials are based on the most recent Mortgage that was taken out on this home.
Original Mortgage
$87,900
Interest Rate
8.01%
Mortgage Type
New Conventional
Create a Home Valuation Report for This Property
The Home Valuation Report is an in-depth analysis detailing your home's value as well as a comparison with similar homes in the area
Home Values in the Area
Average Home Value in this Area
Purchase History
| Date | Buyer | Sale Price | Title Company |
|---|---|---|---|
| Abert Denys | $302,000 | -- | |
| Brown William K | $154,000 | -- | |
| Pruitt Harvey E | $122,900 | -- |
Source: Public Records
Mortgage History
| Date | Status | Borrower | Loan Amount |
|---|---|---|---|
| Open | Abert Denys | $286,900 | |
| Previous Owner | Brown William K | $152,700 | |
| Previous Owner | Pruitt Harvey E | $87,900 |
Source: Public Records
Tax History Compared to Growth
Tax History
| Year | Tax Paid | Tax Assessment Tax Assessment Total Assessment is a certain percentage of the fair market value that is determined by local assessors to be the total taxable value of land and additions on the property. | Land | Improvement |
|---|---|---|---|---|
| 2025 | $5,398 | $182,880 | $32,800 | $150,080 |
| 2024 | $5,771 | $192,680 | $34,000 | $158,680 |
| 2023 | $5,771 | $169,240 | $30,400 | $138,840 |
| 2022 | $5,062 | $159,880 | $27,200 | $132,680 |
| 2021 | $4,311 | $120,800 | $22,360 | $98,440 |
| 2020 | $1,490 | $106,960 | $20,720 | $86,240 |
| 2019 | $1,490 | $97,760 | $17,920 | $79,840 |
| 2018 | $1,388 | $90,880 | $17,920 | $72,960 |
| 2016 | $2,815 | $75,440 | $14,400 | $61,040 |
| 2015 | $2,641 | $69,840 | $12,000 | $57,840 |
| 2014 | -- | $70,400 | $12,000 | $58,400 |
Source: Public Records
Map
Nearby Homes
- 2740 Talley Ln
- 2726 Talley Ln
- 2724 Talley Ln
- 4162 Wyndham Ridge Ct Unit 3
- 4292 Sardis Church Rd
- 3475 Duncan Bridge Dr Unit 2
- 4728 Moon Hollow Ct
- 4732 Moon Chase Dr
- 4602 Shay Terrace
- 2590 Hamilton Parc Ln
- 4761 Moon Chase Dr
- 4785 Nolans Ridge
- 2485 Hamilton Parc Ln
- 2732 Thompson Mill Rd
- 2415 Hamilton Parc Ln
- 2424 Pinnae Place
- 2839 Suttonwood Way
- 3941 Adler Cir
- 2705 Wyndham Park Dr
- 2715 Wyndham Park Dr Unit 1
- 2695 Wyndham Park Dr
- 2725 Wyndham Park Dr NE
- 2700 Wyndham Park Dr Unit 1
- 2725 Wyndham Park Dr
- 2720 Wyndham Park Dr
- 2710 Wyndham Park Dr
- 2685 Wyndham Park Dr NE
- 0 Wyndham Park Dr NE Unit 7438395
- 0 Wyndham Park Dr NE Unit 7285447
- 0 Wyndham Park Dr NE Unit 7197110
- 0 Wyndham Park Dr NE Unit 3229189
- 0 Wyndham Park Dr NE Unit 8363986
- 0 Wyndham Park Dr NE Unit 8923810
- 0 Wyndham Park Dr NE Unit 8961957
- 0 Wyndham Park Dr NE Unit 8965741
- 0 Wyndham Park Dr NE Unit 9043543
- 2540 Wyndham Park Dr NE
- 0 Wyndham Park Dr NE