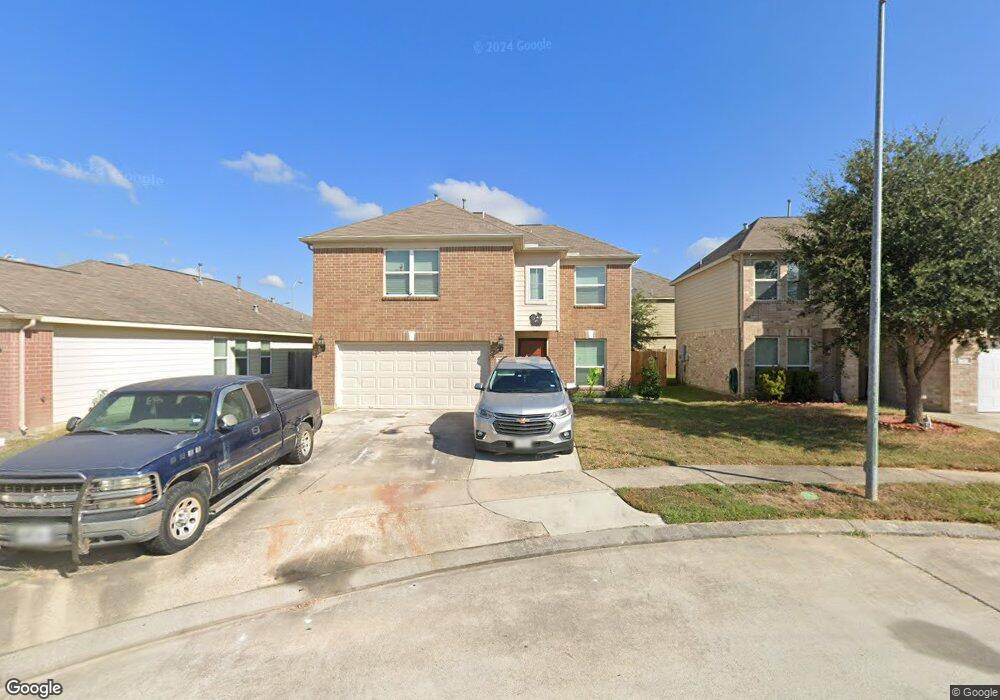
2706 Magnolia Hill Trail Houston, TX 77038
North Houston NeighborhoodEstimated Value: $246,565 - $265,000
3
Beds
3
Baths
1,960
Sq Ft
$131/Sq Ft
Est. Value
About This Home
This home is located at 2706 Magnolia Hill Trail, Houston, TX 77038 and is currently estimated at $255,891, approximately $130 per square foot. 2706 Magnolia Hill Trail is a home located in Fort Bend County with nearby schools including Gloria B. Sammons Elementary School, Stovall School, and Dr. Viola K. Garcia Middle School.
Ownership History
Date
Name
Owned For
Owner Type
Purchase Details
Closed on
May 10, 2019
Sold by
Vasquez Ervin Joel and Trigueros Stephanie
Bought by
Alvarez Sandra
Current Estimated Value
Home Financials for this Owner
Home Financials are based on the most recent Mortgage that was taken out on this home.
Original Mortgage
$86,850
Outstanding Balance
$76,204
Interest Rate
4.1%
Mortgage Type
New Conventional
Estimated Equity
$179,687
Purchase Details
Closed on
Mar 30, 2012
Sold by
Long Lake Ltd
Bought by
Vasquez Ervin Joel
Home Financials for this Owner
Home Financials are based on the most recent Mortgage that was taken out on this home.
Original Mortgage
$4,044
Interest Rate
3.92%
Mortgage Type
Unknown
Create a Home Valuation Report for This Property
The Home Valuation Report is an in-depth analysis detailing your home's value as well as a comparison with similar homes in the area
Home Values in the Area
Average Home Value in this Area
Purchase History
| Date | Buyer | Sale Price | Title Company |
|---|---|---|---|
| Alvarez Sandra | -- | North Star Title Company | |
| Vasquez Ervin Joel | -- | South Land Title Llc |
Source: Public Records
Mortgage History
| Date | Status | Borrower | Loan Amount |
|---|---|---|---|
| Open | Alvarez Sandra | $86,850 | |
| Previous Owner | Vasquez Ervin Joel | $4,044 | |
| Previous Owner | Vasquez Ervin Joel | $4,044 |
Source: Public Records
Tax History Compared to Growth
Tax History
| Year | Tax Paid | Tax Assessment Tax Assessment Total Assessment is a certain percentage of the fair market value that is determined by local assessors to be the total taxable value of land and additions on the property. | Land | Improvement |
|---|---|---|---|---|
| 2025 | $6,069 | $230,791 | $44,256 | $186,535 |
| 2024 | $6,069 | $230,791 | $44,256 | $186,535 |
| 2023 | $6,069 | $248,694 | $44,256 | $204,438 |
| 2022 | $6,082 | $221,061 | $21,075 | $199,986 |
| 2021 | $5,177 | $181,633 | $21,075 | $160,558 |
| 2020 | $5,009 | $165,767 | $21,075 | $144,692 |
| 2019 | $4,899 | $156,311 | $21,075 | $135,236 |
| 2018 | $1,750 | $146,889 | $16,438 | $130,451 |
| 2017 | $4,237 | $146,889 | $16,438 | $130,451 |
| 2016 | $3,852 | $136,233 | $16,438 | $119,795 |
| 2015 | $3,327 | $136,233 | $16,438 | $119,795 |
| 2014 | $3,327 | $104,941 | $16,438 | $88,503 |
Source: Public Records
Map
Nearby Homes
- 2719 Magnolia Hill Trail
- 2530 Woodtown Dr
- 2811 Oakland Brook St
- 2831 Oakland Brook St
- 2614 Lemonwood Ln
- 2835 Oakland Brook St
- 2838 Packard Elm St
- 3127 Frick Rd
- 13308 Ann Louise Rd
- 2919 Sunwood Dr
- 13803 Bearwood Rd
- 12611 Landon Light Ln
- 2203 Chalet Rd
- 2115 Havencrest Dr
- 12718 Sai Baba Dr
- 2322 Hadden Hollow Dr
- 3265 Frick Rd
- 3240 Brownie Campbell Rd
- 14003 Valley Grove Dr
- 10915 Meadow Walk Ln
- 2710 Magnolia Hill Trail
- 2702 Magnolia Hill Trail
- 13402 Dahlia Green Way
- 2714 Magnolia Hill Trail
- 13406 Dahlia Green Way
- 2718 Magnolia Hill Trail
- 13410 Dahlia Green Way
- 2711 Magnolia Hill Trail
- 2707 Magnolia Hill Trail
- 2722 Magnolia Hill Trail
- 13407 Dahlia Green Way
- 2703 Magnolia Hill Trail
- 2715 Magnolia Hill Trail
- 13414 Dahlia Green Way
- 13411 Dahlia Green Way
- 2726 Magnolia Hill Trail
- 13402 Country Path Way
- 13415 Dahlia Green Way
- 13418 Dahlia Green Way
- 2723 Magnolia Hill Trail