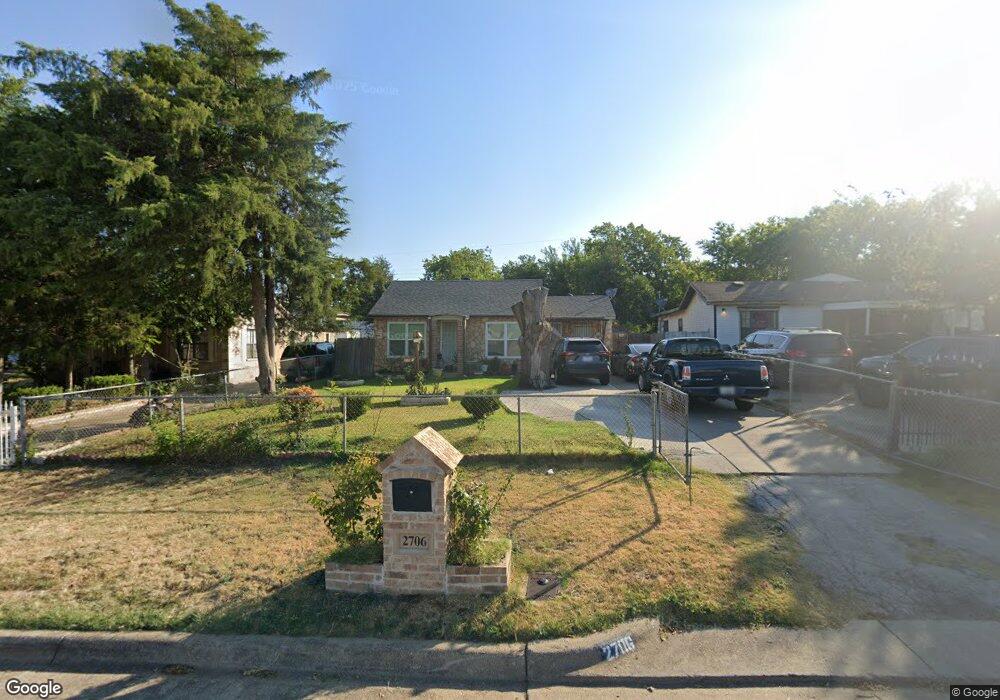
2706 NW 23rd St Fort Worth, TX 76106
Northside NeighborhoodEstimated Value: $174,878 - $197,000
2
Beds
1
Bath
816
Sq Ft
$231/Sq Ft
Est. Value
About This Home
This home is located at 2706 NW 23rd St, Fort Worth, TX 76106 and is currently estimated at $188,220, approximately $230 per square foot. 2706 NW 23rd St is a home located in Tarrant County with nearby schools including Dolores Huerta Elementary School, Kirkpatrick Middle School, and North Side High School.
Ownership History
Date
Name
Owned For
Owner Type
Purchase Details
Closed on
Jan 27, 2006
Sold by
Akel Elias
Bought by
Morales Amado A and Morales Daisy
Current Estimated Value
Home Financials for this Owner
Home Financials are based on the most recent Mortgage that was taken out on this home.
Original Mortgage
$37,900
Outstanding Balance
$21,387
Interest Rate
6.24%
Mortgage Type
Fannie Mae Freddie Mac
Estimated Equity
$166,833
Purchase Details
Closed on
Dec 28, 2005
Sold by
Lasalle Bank Na
Bought by
Akel Elias
Home Financials for this Owner
Home Financials are based on the most recent Mortgage that was taken out on this home.
Original Mortgage
$37,900
Outstanding Balance
$21,387
Interest Rate
6.24%
Mortgage Type
Fannie Mae Freddie Mac
Estimated Equity
$166,833
Purchase Details
Closed on
Sep 6, 2005
Sold by
Bevil Jean
Bought by
Lasalle Bank Na and Holders Of Structured Asset Securities C
Create a Home Valuation Report for This Property
The Home Valuation Report is an in-depth analysis detailing your home's value as well as a comparison with similar homes in the area
Home Values in the Area
Average Home Value in this Area
Purchase History
| Date | Buyer | Sale Price | Title Company |
|---|---|---|---|
| Morales Amado A | -- | Republic Title Of Texas Inc | |
| Akel Elias | -- | Fidelity National Title Agen | |
| Lasalle Bank Na | $48,778 | -- |
Source: Public Records
Mortgage History
| Date | Status | Borrower | Loan Amount |
|---|---|---|---|
| Open | Morales Amado A | $37,900 |
Source: Public Records
Tax History Compared to Growth
Tax History
| Year | Tax Paid | Tax Assessment Tax Assessment Total Assessment is a certain percentage of the fair market value that is determined by local assessors to be the total taxable value of land and additions on the property. | Land | Improvement |
|---|---|---|---|---|
| 2025 | $77 | $162,306 | $49,000 | $113,306 |
| 2024 | $77 | $162,306 | $49,000 | $113,306 |
| 2023 | $77 | $148,434 | $35,000 | $113,434 |
| 2022 | $1,976 | $111,684 | $13,000 | $98,684 |
| 2021 | $1,895 | $101,155 | $13,000 | $88,155 |
| 2020 | $1,662 | $79,332 | $13,000 | $66,332 |
| 2019 | $1,571 | $79,958 | $13,000 | $66,958 |
| 2018 | $1,009 | $51,909 | $13,000 | $38,909 |
| 2017 | $1,337 | $50,009 | $13,000 | $37,009 |
| 2016 | $1,215 | $50,403 | $13,000 | $37,403 |
| 2015 | $842 | $39,000 | $13,110 | $25,890 |
| 2014 | $842 | $39,000 | $13,110 | $25,890 |
Source: Public Records
Map
Nearby Homes
- 2707 NW 24th St
- 2719 NW 25th St
- 2814 NW 20th St
- 2717 NW 27th St
- 2500 NW 20th St
- 2907 NW 26th St
- 2903 NW 18th St
- 2808 NW 17th St
- 2806 NW 17th St
- 2901 NW 18th St
- 2801 NW 17th St
- 2517 NW 29th St
- 2250 Capri Dr
- 3114 NW 23rd St
- 2900 Jacksboro Hwy
- 4812 Flagstone Dr
- 5005 Jacksboro Hwy
- 4925 Terrace Trail
- 5001 Jacksboro Hwy
- 1617 Hillside Dr
- 2708 NW 23rd St
- 2704 NW 23rd St
- 2710 NW 23rd St
- 2702 NW 23rd St
- 2712 NW 23rd St
- 2700 NW 23rd St
- 2705 NW 24th St
- 2709 NW 24th St
- 2711 NW 24th St
- 2707 NW 23rd St
- 2714 NW 23rd St
- 2705 NW 23rd St
- 2709 NW 23rd St
- 2701 NW 24th St
- 2713 NW 24th St
- 2711 NW 23rd St
- 2701 NW 23rd St
- 2713 NW 23rd St
- 2716 NW 23rd St
- 2715 NW 23rd St