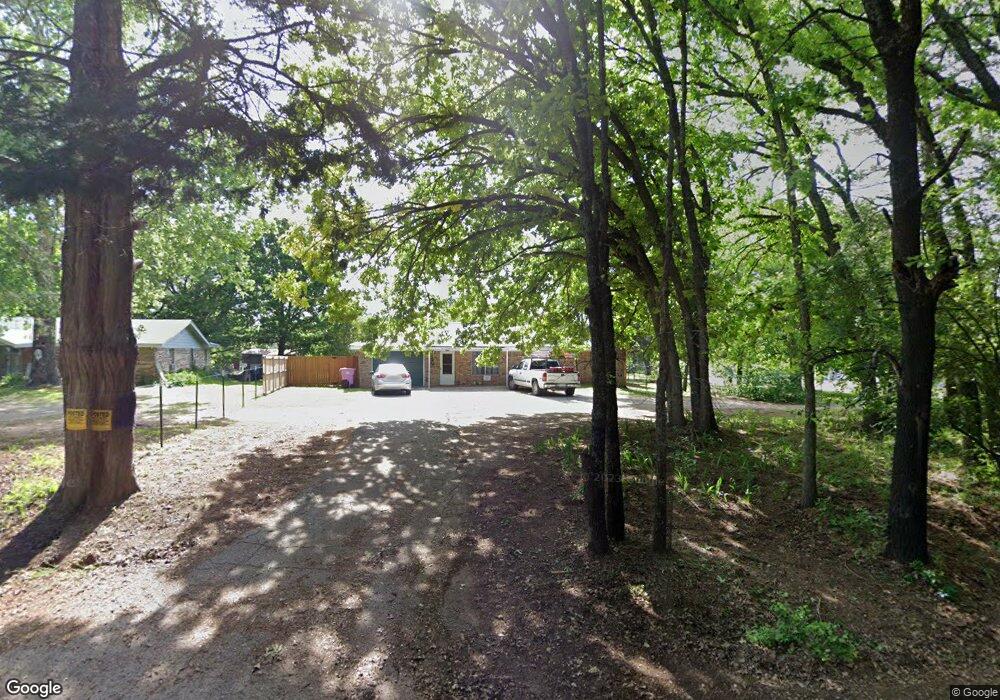
2706 Oak Ridge Rd Denison, TX 75021
Estimated Value: $195,000
--
Bed
--
Bath
966
Sq Ft
$202/Sq Ft
Est. Value
About This Home
This home is located at 2706 Oak Ridge Rd, Denison, TX 75021 and is currently estimated at $195,000, approximately $201 per square foot. 2706 Oak Ridge Rd is a home located in Grayson County with nearby schools including Terrell Elementary School, Scott Middle School, and Denison High School.
Ownership History
Date
Name
Owned For
Owner Type
Purchase Details
Closed on
Aug 23, 2024
Sold by
Jeje Holdings Llc
Bought by
Earnhart Terry
Current Estimated Value
Home Financials for this Owner
Home Financials are based on the most recent Mortgage that was taken out on this home.
Original Mortgage
$13,000
Outstanding Balance
$12,660
Interest Rate
6.89%
Mortgage Type
Seller Take Back
Estimated Equity
$182,340
Purchase Details
Closed on
Aug 1, 2023
Sold by
Earnhart Terry Joe
Bought by
Jeje Holdings Llc
Purchase Details
Closed on
Aug 20, 2020
Sold by
Earnhart Thomas K
Bought by
Gatlin Cole and Gatlin Lisa
Home Financials for this Owner
Home Financials are based on the most recent Mortgage that was taken out on this home.
Original Mortgage
$173,794
Interest Rate
3%
Mortgage Type
FHA
Create a Home Valuation Report for This Property
The Home Valuation Report is an in-depth analysis detailing your home's value as well as a comparison with similar homes in the area
Home Values in the Area
Average Home Value in this Area
Purchase History
| Date | Buyer | Sale Price | Title Company |
|---|---|---|---|
| Earnhart Terry | -- | None Listed On Document | |
| Jeje Holdings Llc | -- | None Listed On Document | |
| Gatlin Cole | -- | Grayson County Title |
Source: Public Records
Mortgage History
| Date | Status | Borrower | Loan Amount |
|---|---|---|---|
| Open | Earnhart Terry | $13,000 | |
| Previous Owner | Gatlin Cole | $173,794 |
Source: Public Records
Tax History Compared to Growth
Tax History
| Year | Tax Paid | Tax Assessment Tax Assessment Total Assessment is a certain percentage of the fair market value that is determined by local assessors to be the total taxable value of land and additions on the property. | Land | Improvement |
|---|---|---|---|---|
| 2025 | $1,828 | $118,805 | $45,733 | $73,072 |
| 2024 | $1,828 | $113,179 | $41,875 | $71,304 |
| 2023 | $1,860 | $115,020 | $41,875 | $73,145 |
| 2022 | $1,735 | $100,426 | $32,112 | $68,314 |
| 2021 | $1,382 | $73,711 | $19,046 | $54,665 |
| 2020 | $3,127 | $157,450 | $9,265 | $148,185 |
| 2019 | $3,066 | $154,439 | $7,654 | $146,785 |
| 2018 | $2,725 | $127,906 | $6,604 | $121,302 |
| 2017 | $2,480 | $114,781 | $6,639 | $108,142 |
| 2016 | $1,315 | $108,120 | $5,395 | $102,725 |
| 2015 | $966 | $99,044 | $4,895 | $94,149 |
| 2014 | -- | $87,275 | $4,895 | $82,380 |
Source: Public Records
Map
Nearby Homes
- 1700 Elmore Rd
- 489 Delphia Dr
- 4489 E Fm 120
- 4489 E Farm To Market 120
- 1988 Elmore Rd
- 320 Elmore Rd
- 4336 Carpenters Bluff Rd
- 725 Carpenters Bluff Rd
- 0000 Carpenters Bluff Rd
- 3091 E Fm 120
- 115 N Main St
- 598 Stagecoach Trail
- TBD E Fm 120
- TBD Singletree Rd
- 4822 Fm 1753
- 2550 Farm To Market Road 120
- TBD NE Fm 1753 & Singletree
- 5.92 Rd
- 2757 Fm 1753
- 426 Gun Club Rd
- 2668 Oak Ridge Rd
- 2666 Oak Ridge Rd
- 2874 Oak Ridge Rd
- 2826 Oak Ridge Rd
- 2912 Oak Ridge Rd
- 2912 Oak Ridge Rd
- 2570 Oak Ridge Rd
- 2989 Oak Ridge Rd
- 2394 Oak Ridge Rd
- 3085 Oak Ridge Rd
- 3132 Oak Ridge Rd
- 5116 E Fm 120
- 5020 E Fm 120
- 2228 Oak Ridge Rd
- 5000 E Fm 120
- 5139 E Fm 120
- 5033 E Fm 120
- 4799 E Fm 120
- 4993 E Fm 120
- 4765 E Fm 120