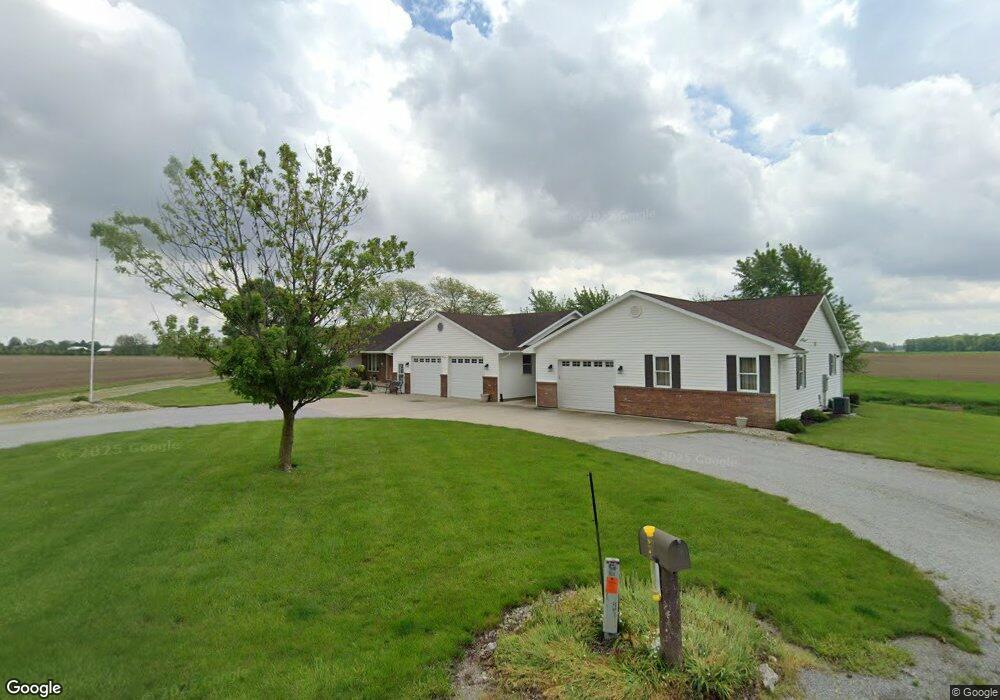
2706 Sharf Rd Delphos, OH 45833
Estimated Value: $299,000 - $443,585
4
Beds
3
Baths
3,803
Sq Ft
$98/Sq Ft
Est. Value
About This Home
This home is located at 2706 Sharf Rd, Delphos, OH 45833 and is currently estimated at $372,646, approximately $97 per square foot. 2706 Sharf Rd is a home located in Allen County.
Ownership History
Date
Name
Owned For
Owner Type
Purchase Details
Closed on
Jun 25, 2019
Sold by
Jamison Sarah
Bought by
Jamison Nicholas and Jamison Sarah
Current Estimated Value
Home Financials for this Owner
Home Financials are based on the most recent Mortgage that was taken out on this home.
Original Mortgage
$159,000
Interest Rate
3.6%
Mortgage Type
New Conventional
Purchase Details
Closed on
Sep 18, 2018
Sold by
Estate Of Michael Jacob Pohlman
Bought by
Pohlman Karen M
Purchase Details
Closed on
Aug 24, 2018
Sold by
Pohlman Karen M and Pohlman Karen
Bought by
Jamison Sarah and Knippen Melany
Purchase Details
Closed on
Sep 5, 1986
Bought by
Pohlman Michael
Create a Home Valuation Report for This Property
The Home Valuation Report is an in-depth analysis detailing your home's value as well as a comparison with similar homes in the area
Home Values in the Area
Average Home Value in this Area
Purchase History
| Date | Buyer | Sale Price | Title Company |
|---|---|---|---|
| Jamison Nicholas | $210,000 | Amrock Inc | |
| Pohlman Karen M | -- | None Available | |
| Jamison Sarah | -- | None Available | |
| Pohlman Michael | $4,300 | -- |
Source: Public Records
Mortgage History
| Date | Status | Borrower | Loan Amount |
|---|---|---|---|
| Previous Owner | Jamison Nicholas | $159,000 |
Source: Public Records
Tax History Compared to Growth
Tax History
| Year | Tax Paid | Tax Assessment Tax Assessment Total Assessment is a certain percentage of the fair market value that is determined by local assessors to be the total taxable value of land and additions on the property. | Land | Improvement |
|---|---|---|---|---|
| 2024 | $4,320 | $135,310 | $12,950 | $122,360 |
| 2023 | $3,042 | $93,320 | $8,930 | $84,390 |
| 2022 | $3,108 | $93,320 | $8,930 | $84,390 |
| 2021 | $3,116 | $93,320 | $8,930 | $84,390 |
| 2020 | $2,031 | $86,770 | $8,330 | $78,440 |
| 2019 | $2,031 | $64,890 | $8,330 | $56,560 |
| 2018 | $1,950 | $64,890 | $8,330 | $56,560 |
| 2017 | $1,858 | $58,560 | $8,330 | $50,230 |
| 2016 | $1,860 | $58,560 | $8,330 | $50,230 |
| 2015 | $2,066 | $58,560 | $8,330 | $50,230 |
| 2014 | $2,066 | $63,420 | $8,330 | $55,090 |
| 2013 | $2,070 | $63,420 | $8,330 | $55,090 |
Source: Public Records
Map
Nearby Homes
- 21302 Masters Rd
- 14101 Allentown Rd
- 19083 Venedocia Eastern Rd
- 19059 Wittington St
- 15044 Main St
- 11630 Clearview Dr
- 18906 Bebb St
- 714 Briggs Ave Unit 1
- 408 N Mulberry St
- 425 N Main St
- 440 W 4th St
- 1001 S Adams St
- 336 W 4th St
- 409 W 4th St
- 827 S Washington St
- 634 S Clay St
- 606 S Cass St
- 213 N Pearl St
- 516 S Main St
- 508 S Washington St