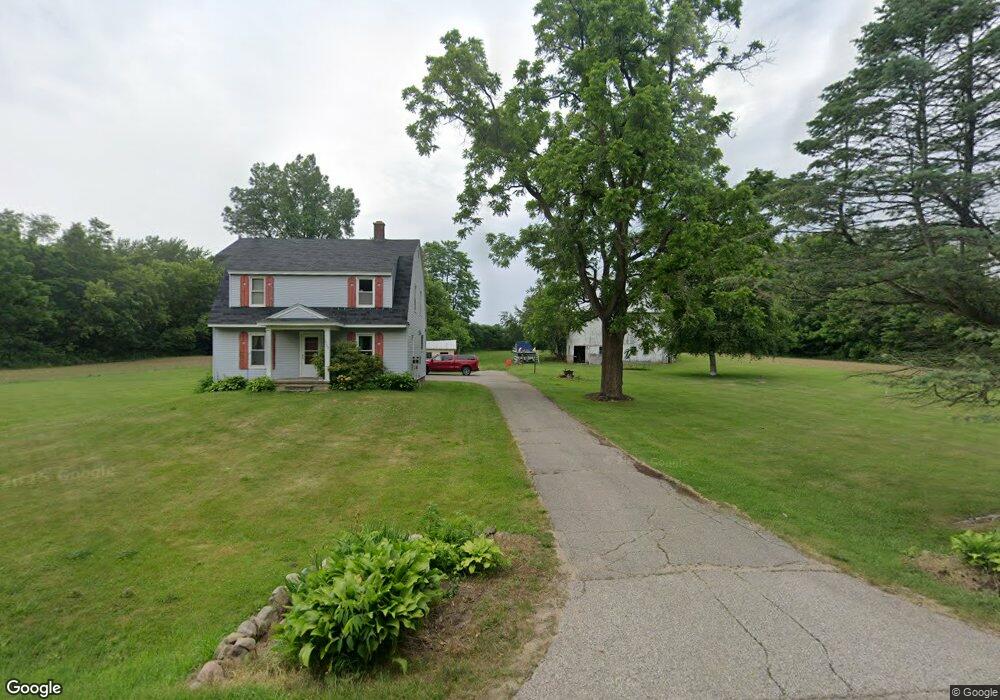
2707 114th Ave Allegan, MI 49010
Estimated Value: $293,745 - $340,000
5
Beds
1
Bath
1,600
Sq Ft
$193/Sq Ft
Est. Value
About This Home
This home is located at 2707 114th Ave, Allegan, MI 49010 and is currently estimated at $308,186, approximately $192 per square foot. 2707 114th Ave is a home located in Allegan County with nearby schools including North Ward Elementary School, L.E. White Middle School, and Allegan High School.
Ownership History
Date
Name
Owned For
Owner Type
Purchase Details
Closed on
Nov 18, 2008
Sold by
Flagstar Bank Fsb
Bought by
Bush Amy L
Current Estimated Value
Home Financials for this Owner
Home Financials are based on the most recent Mortgage that was taken out on this home.
Original Mortgage
$76,000
Outstanding Balance
$47,128
Interest Rate
4.99%
Mortgage Type
Seller Take Back
Estimated Equity
$261,058
Purchase Details
Closed on
Apr 16, 2008
Sold by
Flagstar Bank Fsb
Bought by
City Of Allegan
Purchase Details
Closed on
Jul 20, 2006
Sold by
Miller David B and Miller Emily A
Bought by
Flagstar Bank Fsb and First Securities Savings Bank Fsb
Create a Home Valuation Report for This Property
The Home Valuation Report is an in-depth analysis detailing your home's value as well as a comparison with similar homes in the area
Home Values in the Area
Average Home Value in this Area
Purchase History
| Date | Buyer | Sale Price | Title Company |
|---|---|---|---|
| Bush Amy L | $95,000 | 1St Choice Title Svcs Inc | |
| City Of Allegan | $34,600 | Chicago Title | |
| Flagstar Bank Fsb | $161,978 | None Available |
Source: Public Records
Mortgage History
| Date | Status | Borrower | Loan Amount |
|---|---|---|---|
| Open | Bush Amy L | $76,000 | |
| Closed | Bush Amy L | $19,000 |
Source: Public Records
Tax History Compared to Growth
Tax History
| Year | Tax Paid | Tax Assessment Tax Assessment Total Assessment is a certain percentage of the fair market value that is determined by local assessors to be the total taxable value of land and additions on the property. | Land | Improvement |
|---|---|---|---|---|
| 2025 | $2,863 | $135,800 | $60,200 | $75,600 |
| 2024 | $2,602 | $116,900 | $47,600 | $69,300 |
| 2023 | $2,602 | $101,700 | $40,100 | $61,600 |
| 2022 | $2,602 | $94,000 | $39,100 | $54,900 |
| 2021 | $2,416 | $91,100 | $39,100 | $52,000 |
| 2020 | $2,416 | $86,600 | $38,800 | $47,800 |
| 2019 | $0 | $81,600 | $35,200 | $46,400 |
| 2018 | $0 | $80,800 | $37,100 | $43,700 |
| 2017 | $0 | $76,200 | $34,500 | $41,700 |
| 2016 | $0 | $71,200 | $31,100 | $40,100 |
| 2015 | -- | $71,200 | $31,100 | $40,100 |
| 2014 | -- | $67,200 | $31,100 | $36,100 |
| 2013 | -- | $67,200 | $32,100 | $35,100 |
Source: Public Records
Map
Nearby Homes