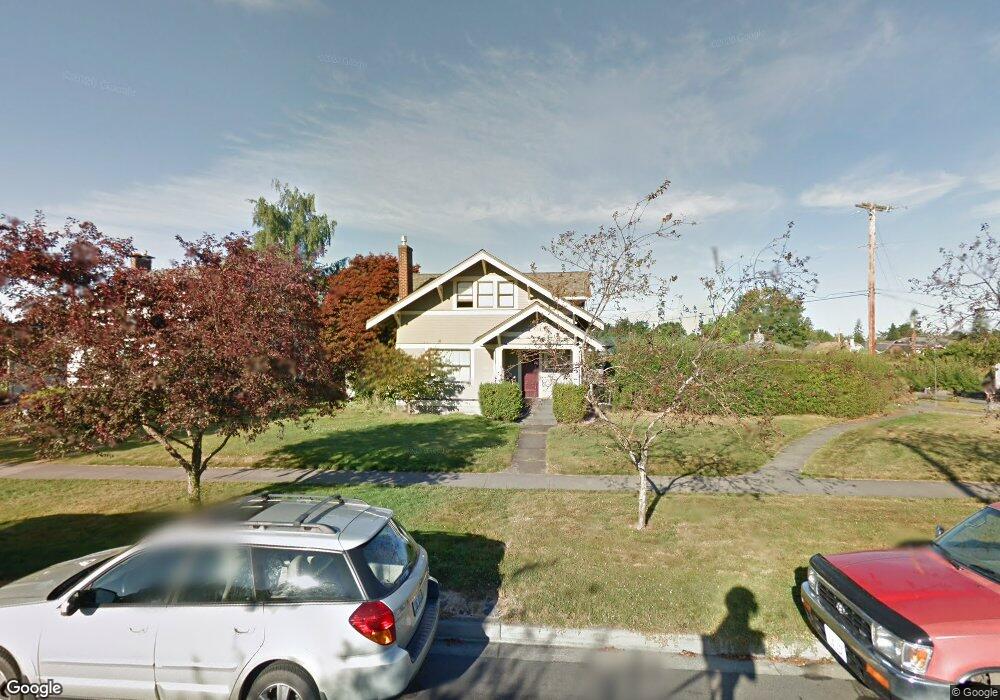
2707 Ellis St Bellingham, WA 98225
Cornwall Park NeighborhoodEstimated Value: $623,000 - $884,000
3
Beds
2
Baths
1,506
Sq Ft
$517/Sq Ft
Est. Value
About This Home
This home is located at 2707 Ellis St, Bellingham, WA 98225 and is currently estimated at $778,437, approximately $516 per square foot. 2707 Ellis St is a home located in Whatcom County with nearby schools including Parkview Elementary School, Whatcom Middle School, and Bellingham High School.
Ownership History
Date
Name
Owned For
Owner Type
Purchase Details
Closed on
Nov 18, 2004
Sold by
Maguire Timothy A and Maguire Rita L
Bought by
Longtine Mark
Current Estimated Value
Home Financials for this Owner
Home Financials are based on the most recent Mortgage that was taken out on this home.
Original Mortgage
$220,000
Outstanding Balance
$108,835
Interest Rate
5.65%
Mortgage Type
Purchase Money Mortgage
Estimated Equity
$669,602
Create a Home Valuation Report for This Property
The Home Valuation Report is an in-depth analysis detailing your home's value as well as a comparison with similar homes in the area
Home Values in the Area
Average Home Value in this Area
Purchase History
| Date | Buyer | Sale Price | Title Company |
|---|---|---|---|
| Longtine Mark | $275,000 | First American Title Insuran |
Source: Public Records
Mortgage History
| Date | Status | Borrower | Loan Amount |
|---|---|---|---|
| Open | Longtine Mark | $220,000 | |
| Closed | Longtine Mark | $41,250 |
Source: Public Records
Tax History Compared to Growth
Tax History
| Year | Tax Paid | Tax Assessment Tax Assessment Total Assessment is a certain percentage of the fair market value that is determined by local assessors to be the total taxable value of land and additions on the property. | Land | Improvement |
|---|---|---|---|---|
| 2024 | $6,297 | $789,163 | $323,274 | $465,889 |
| 2023 | $6,297 | $809,207 | $331,485 | $477,722 |
| 2022 | $5,143 | $697,605 | $285,768 | $411,837 |
| 2021 | $5,045 | $553,654 | $226,800 | $326,854 |
| 2020 | $5,080 | $512,643 | $210,000 | $302,643 |
| 2019 | $4,548 | $498,899 | $201,308 | $297,591 |
| 2018 | $4,580 | $447,835 | $180,738 | $267,097 |
| 2017 | $3,950 | $385,571 | $155,606 | $229,965 |
| 2016 | $3,456 | $347,535 | $139,634 | $207,901 |
| 2015 | $3,389 | $316,601 | $127,534 | $189,067 |
| 2014 | -- | $0 | $0 | $0 |
| 2013 | -- | $0 | $0 | $0 |
Source: Public Records
Map
Nearby Homes
- 206 Brier Ln
- 2649 Hampton Place
- 2645 Hampton Place
- 200 Brier Ln
- 2801 Ellis St
- 2750 S Park Dr
- 2639 Hampton Place
- 2805 Ellis St
- 2706 Ellis St
- 2712 Ellis St
- 2740 S Park Dr
- 2700 Ellis St
- 2800 Lyle St
- 2716 Ellis St
- 2637 Hampton Place
- 2807 Ellis St
- 2724 Ellis St
- 2736 S Park Dr
- 2804 Lyle St
- 2635 Hampton Place