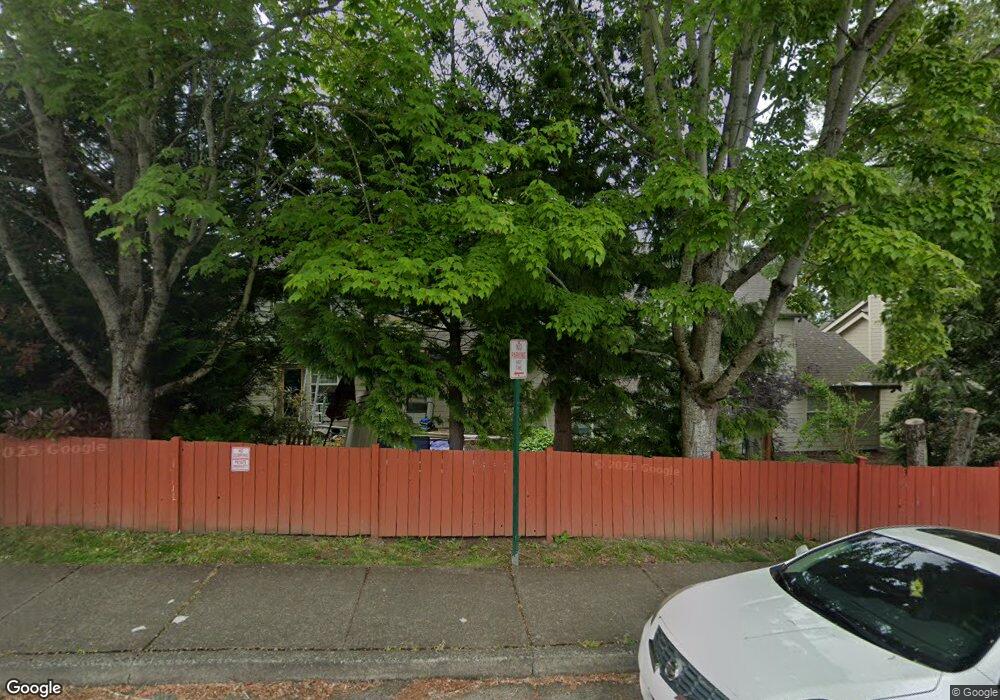
2707 Silesia Ln Unit D Bellingham, WA 98226
Roosevelt NeighborhoodEstimated Value: $361,000 - $379,000
2
Beds
2
Baths
1,047
Sq Ft
$353/Sq Ft
Est. Value
About This Home
This home is located at 2707 Silesia Ln Unit D, Bellingham, WA 98226 and is currently estimated at $369,433, approximately $352 per square foot. 2707 Silesia Ln Unit D is a home located in Whatcom County with nearby schools including Sunnyland Elementary School, Shuksan Middle School, and Squalicum High School.
Ownership History
Date
Name
Owned For
Owner Type
Purchase Details
Closed on
Jul 2, 2017
Sold by
Vingelen William S and Vingelen Jodi Renee
Bought by
Rhea Chelsea
Current Estimated Value
Home Financials for this Owner
Home Financials are based on the most recent Mortgage that was taken out on this home.
Original Mortgage
$196,377
Interest Rate
3.75%
Mortgage Type
FHA
Purchase Details
Closed on
Feb 28, 2003
Sold by
Ellars Franklin J and Ellars Shawna M
Bought by
Vingelen William S and Berger Jodi R
Home Financials for this Owner
Home Financials are based on the most recent Mortgage that was taken out on this home.
Original Mortgage
$103,750
Interest Rate
5.85%
Mortgage Type
FHA
Purchase Details
Closed on
Jul 18, 2000
Sold by
Bernard Thomas Wayne and Shafer Mary Frances
Bought by
Ellars Franklin J
Home Financials for this Owner
Home Financials are based on the most recent Mortgage that was taken out on this home.
Original Mortgage
$73,480
Interest Rate
8.37%
Create a Home Valuation Report for This Property
The Home Valuation Report is an in-depth analysis detailing your home's value as well as a comparison with similar homes in the area
Home Values in the Area
Average Home Value in this Area
Purchase History
| Date | Buyer | Sale Price | Title Company |
|---|---|---|---|
| Rhea Chelsea | $200,000 | Chicago Title Insurance | |
| Vingelen William S | $107,000 | Stewart Title Company | |
| Ellars Franklin J | $91,850 | Whatcom Land Title |
Source: Public Records
Mortgage History
| Date | Status | Borrower | Loan Amount |
|---|---|---|---|
| Previous Owner | Rhea Chelsea | $196,377 | |
| Previous Owner | Vingelen William S | $103,750 | |
| Previous Owner | Ellars Franklin J | $73,480 |
Source: Public Records
Tax History Compared to Growth
Tax History
| Year | Tax Paid | Tax Assessment Tax Assessment Total Assessment is a certain percentage of the fair market value that is determined by local assessors to be the total taxable value of land and additions on the property. | Land | Improvement |
|---|---|---|---|---|
| 2024 | $2,898 | $372,090 | $57,152 | $314,938 |
| 2023 | $2,898 | $372,090 | $57,152 | $314,938 |
| 2022 | $2,528 | $307,518 | $47,234 | $260,284 |
| 2021 | $2,435 | $272,140 | $41,800 | $230,340 |
| 2020 | $2,336 | $247,400 | $38,000 | $209,400 |
| 2019 | $1,920 | $229,421 | $36,644 | $192,777 |
| 2018 | $2,030 | $189,101 | $30,204 | $158,897 |
| 2017 | $1,795 | $170,885 | $27,294 | $143,591 |
| 2016 | $1,630 | $157,925 | $25,224 | $132,701 |
| 2015 | $1,625 | $149,285 | $23,844 | $125,441 |
| 2014 | -- | $144,000 | $23,000 | $121,000 |
| 2013 | -- | $154,911 | $23,568 | $131,343 |
Source: Public Records
Map
Nearby Homes
- 1735 Sunup Loop
- 1737 Sunup Loop
- 1733 Sunup Loop
- 1712 Sunup Loop
- 1714 Sunup Loop
- 1716 Sunup Loop
- 2602 Woburn St
- 2330 Verona St
- 2325 Valencia St
- 2312 Orleans St
- 2409 Xenia St
- 2316 Xenia St
- 2735 Michigan St
- 2935 King St
- 2138 Woburn St
- 3374 Southbend Place Unit 101
- 1825 E Sunset Dr
- 950 Yew St
- 2432 Grant St
- 2413 E Sunset Dr
- 2707 Silesia Ln
- 2707 Silesia Ln Unit C
- 2707 Silesia Ln Unit B
- 2707 Silesia Ln Unit A
- 2701 Silesia Ln Unit B
- 2701 Silesia Ln Unit A
- 1706 Valhalla St
- 2720 Saint Paul St
- 1701 Valhalla Ln
- 1701 Valhalla Ln Unit C
- 1701 Valhalla Ln Unit B
- 1701 Valhalla Ln Unit A
- 1620 Valhalla St
- 2700 Silesia Ln Unit B
- 2700 Silesia Ln Unit A
- 2700 Silesia Ln
- 2705 St Paul St
- 1705 Valhalla Ln
- 1705 Valhalla Ln Unit B
- 1705 Valhalla Ln Unit A