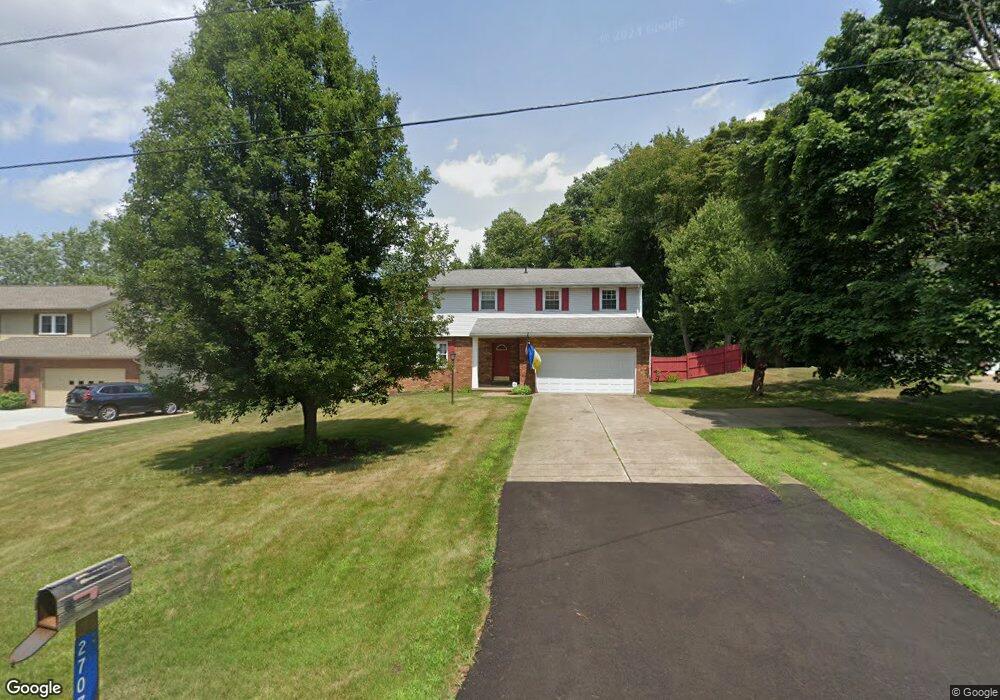
2707 State St NW Uniontown, OH 44685
Estimated Value: $296,029 - $346,000
3
Beds
2
Baths
2,246
Sq Ft
$140/Sq Ft
Est. Value
About This Home
This home is located at 2707 State St NW, Uniontown, OH 44685 and is currently estimated at $313,507, approximately $139 per square foot. 2707 State St NW is a home located in Stark County with nearby schools including North Canton Middle School, Hoover High School, and St Paul School.
Ownership History
Date
Name
Owned For
Owner Type
Purchase Details
Closed on
Jul 28, 2023
Sold by
Bleakley William David and Bleakley June Elizabeth
Bought by
Bleakley Family Revocable Trust and Bleakley
Current Estimated Value
Purchase Details
Closed on
Oct 29, 1999
Sold by
Bleakley William David
Bought by
Bleakley William David and Bleakley June Elizabeth
Home Financials for this Owner
Home Financials are based on the most recent Mortgage that was taken out on this home.
Original Mortgage
$124,438
Interest Rate
7.87%
Mortgage Type
FHA
Purchase Details
Closed on
Oct 28, 1999
Sold by
Thurman Robert C and Thurman Darla R
Bought by
Bleakley William David
Home Financials for this Owner
Home Financials are based on the most recent Mortgage that was taken out on this home.
Original Mortgage
$124,438
Interest Rate
7.87%
Mortgage Type
FHA
Create a Home Valuation Report for This Property
The Home Valuation Report is an in-depth analysis detailing your home's value as well as a comparison with similar homes in the area
Home Values in the Area
Average Home Value in this Area
Purchase History
| Date | Buyer | Sale Price | Title Company |
|---|---|---|---|
| Bleakley Family Revocable Trust | -- | None Listed On Document | |
| Bleakley William David | -- | -- | |
| Bleakley William David | $124,900 | -- |
Source: Public Records
Mortgage History
| Date | Status | Borrower | Loan Amount |
|---|---|---|---|
| Previous Owner | Bleakley William David | $124,438 |
Source: Public Records
Tax History Compared to Growth
Tax History
| Year | Tax Paid | Tax Assessment Tax Assessment Total Assessment is a certain percentage of the fair market value that is determined by local assessors to be the total taxable value of land and additions on the property. | Land | Improvement |
|---|---|---|---|---|
| 2025 | -- | $83,380 | $20,830 | $62,550 |
| 2024 | -- | $83,380 | $20,830 | $62,550 |
| 2023 | $3,317 | $62,720 | $17,780 | $44,940 |
| 2022 | $3,181 | $62,720 | $17,780 | $44,940 |
| 2021 | $3,273 | $62,720 | $17,780 | $44,940 |
| 2020 | $3,221 | $56,390 | $15,330 | $41,060 |
| 2019 | $3,015 | $47,950 | $15,330 | $32,620 |
| 2018 | $2,656 | $47,950 | $15,330 | $32,620 |
| 2017 | $2,248 | $42,770 | $13,650 | $29,120 |
| 2016 | $2,257 | $42,770 | $13,650 | $29,120 |
| 2015 | $2,266 | $42,770 | $13,650 | $29,120 |
| 2014 | $30 | $36,300 | $11,590 | $24,710 |
| 2013 | $1,016 | $36,300 | $11,590 | $24,710 |
Source: Public Records
Map
Nearby Homes
- 2709 Country Squire St NW
- 9364 Pheasant Valley Ave NW
- 9276 Shipton Cir NW
- 3047 Chalford Cir NW Unit 46B
- 9760 Summerset Ave NW
- 9520-9570 Cleveland Ave NW
- 9120 Bletchley Ave NW
- 2870 Brouse St NW
- 10044 Cleveland Ave NW
- 3322 Perrydale St NW
- 2884 Sutherland Cir NW
- 2840 Barclay Cir NW
- 9133 Wellspring Ave NW
- 3564 Shepherd St NW
- 10380 Sudbury Cir NW
- 8510 Deacon Ave NW
- 3048 Wright Rd NW
- 10531 Newbury Ave NW
- 3278 Sumser St NW Unit 2
- 3620 Cain St NW
- 2681 State St NW
- 2723 State St NW
- 2652 Country Squire St NW
- VL State St NW
- 0 State St NW
- 2640 Country Squire St NW
- 2668 Country Squire St NW
- 2665 State St NW
- 2735 State St NW
- 2624 Country Squire St NW
- 2680 Country Squire St NW
- 2705 Shillingford Cir NW
- 2685 Shillingford Cir NW
- 2653 State St NW
- 2747 State St NW
- 2725 Shillingford Cir NW
- 0 State St NW
- 2671 Shillingford Cir NW
- 2698 Country Squire St NW
- 1175 State St NW