


2708 Beynon Ln NE Suwanee, GA 30024
About This Home
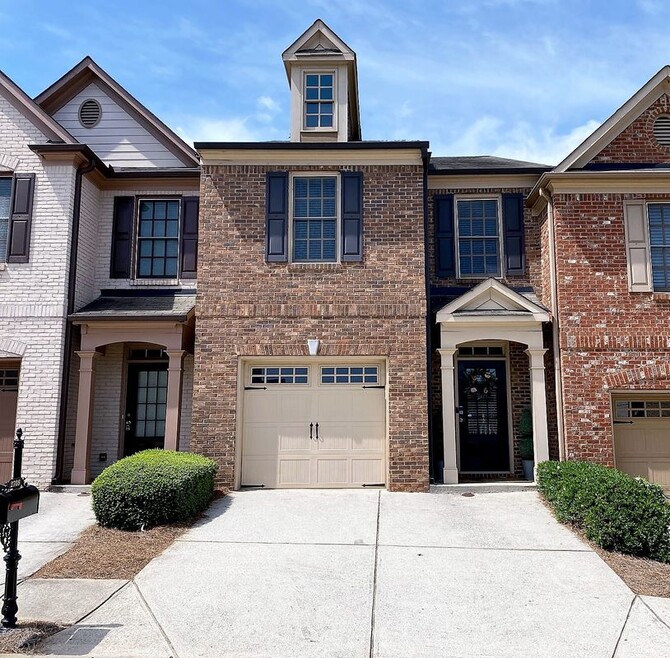
Welcome to your new home in Suwanee, GA! This charming 2-bedroom, 2.5-bathroom townhome boasts a spacious 1,798 square feet of well-designed, fully furnished living space and is located in a vibrant neighborhood. Built in 2007, this residence features a welcoming foyer and a cozy living room complete with a fireplace, perfect for relaxing evenings. The elegant dining area and well-equipped kitchen, complete with modern appliances and a central island, make entertaining a delight.
Enjoy the convenience of a dedicated laundry area featuring a washer and dryer. The private backyard offers a patio area ideal for both relaxation and entertaining. Additional community amenities include a community pool, playground, sidewalks, & entrance gate.
Utilities covered by the homeowners' association include water/sewer, landscaping, and waste management, ensuring a hassle-free living experience. Included in the monthly rent is a $200 allowance towards the gas & electric utilities, making this property every tenant's dream. Don't miss out on this opportunity to live in a desirable location with nearby dining options, grocery stores, and quick access to Northside Hospital Gwinnett. Schedule a tour today!

Map
- 2538 Brynfield Cove
- 2689 Richmond Row Dr
- 2419 Richmond Row Dr
- 487 Danville Ave
- 2500 Peregrine Trail
- 1953 Frisco Way
- 1365 Old Peachtree Rd NW
- 390 Manor Glen Dr
- 267 Arbour Way
- 318 Arbour Way Unit 4
- 620 Telfair Ct
- 118 Basil Ct
- 295 Old Peachtree Rd NW
- 2470 Jakin Way
- 2430 Jakin Way
- 3390 Northcliff Dr
- 565 Paris Dr
- 2315 Prosperity Way Unit 2
- 578 Summerbrooke Ct
- 2708 Beynon Ln
- 306 Knelston Oak Dr
- 2528 Brynfield Cove
- 2611 Peregrine Ct
- 2950 Richmond Row Dr
- 2501 Peregrine Trail
- 2545 Falcon Chase Ct
- 400 Manor Glen Dr
- 2525 Falcon Chase Ct
- 597 Jackson Park Ln
- 660 Peachtree Trails Dr
- 487 Arbour Run
- 620 Manor Glen Dr
- 2915 White Blossom Ln
- 143 Basil Ct
- 716 Jackson Park Ln NW
- 710 Suwanee Lakes Cir NW
- 3390 Northcliff Dr
- 2624 Sterling Dr NW
- 3305 Northcliff Dr