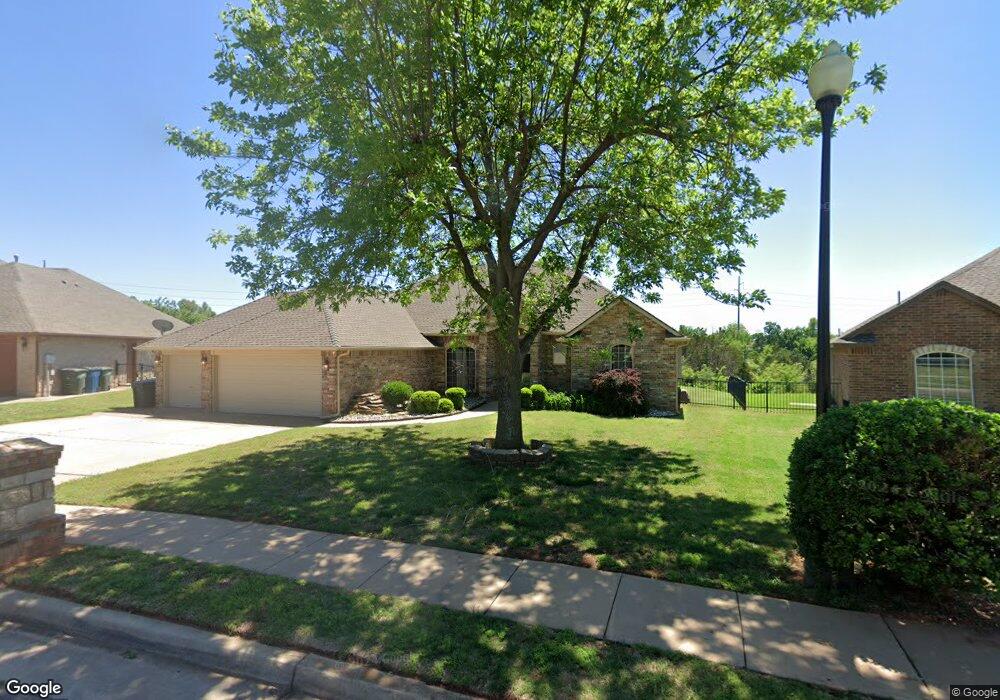
2708 Brenton Dr Edmond, OK 73012
Homestead NeighborhoodEstimated Value: $362,000 - $402,000
4
Beds
3
Baths
2,645
Sq Ft
$142/Sq Ft
Est. Value
About This Home
This home is located at 2708 Brenton Dr, Edmond, OK 73012 and is currently estimated at $376,128, approximately $142 per square foot. 2708 Brenton Dr is a home located in Oklahoma County with nearby schools including Frontier Elementary, Cheyenne Middle School, and North High School.
Ownership History
Date
Name
Owned For
Owner Type
Purchase Details
Closed on
Oct 19, 2005
Sold by
Coffman Don W and Coffman Colleen
Bought by
Parmley James A and Parmley Rose Mary
Current Estimated Value
Home Financials for this Owner
Home Financials are based on the most recent Mortgage that was taken out on this home.
Original Mortgage
$238,829
Outstanding Balance
$128,958
Interest Rate
5.9%
Mortgage Type
VA
Estimated Equity
$247,170
Purchase Details
Closed on
Feb 13, 2003
Sold by
The Donald W Coffman Revocable Trust
Bought by
Coffman Donald W
Purchase Details
Closed on
Feb 15, 2001
Sold by
Custom Crafted Homes Inc
Bought by
The Donald W Coffman Revocable Trust
Purchase Details
Closed on
Feb 21, 2000
Sold by
Danforth Development Llc
Bought by
Custom Crafted Homes Inc
Home Financials for this Owner
Home Financials are based on the most recent Mortgage that was taken out on this home.
Original Mortgage
$165,800
Interest Rate
8.31%
Create a Home Valuation Report for This Property
The Home Valuation Report is an in-depth analysis detailing your home's value as well as a comparison with similar homes in the area
Home Values in the Area
Average Home Value in this Area
Purchase History
| Date | Buyer | Sale Price | Title Company |
|---|---|---|---|
| Parmley James A | $231,500 | First American Title & Tr Co | |
| Coffman Donald W | -- | First Amer Title & Trust Co | |
| The Donald W Coffman Revocable Trust | $208,500 | First Amer Title & Trust Co | |
| Custom Crafted Homes Inc | $31,000 | -- |
Source: Public Records
Mortgage History
| Date | Status | Borrower | Loan Amount |
|---|---|---|---|
| Open | Parmley James A | $238,829 | |
| Previous Owner | Custom Crafted Homes Inc | $165,800 |
Source: Public Records
Tax History Compared to Growth
Tax History
| Year | Tax Paid | Tax Assessment Tax Assessment Total Assessment is a certain percentage of the fair market value that is determined by local assessors to be the total taxable value of land and additions on the property. | Land | Improvement |
|---|---|---|---|---|
| 2024 | $3,445 | $34,699 | $4,749 | $29,950 |
| 2023 | $3,445 | $33,046 | $4,709 | $28,337 |
| 2022 | $3,293 | $31,473 | $5,169 | $26,304 |
| 2021 | $3,122 | $29,975 | $5,509 | $24,466 |
| 2020 | $3,084 | $29,260 | $5,585 | $23,675 |
| 2019 | $3,047 | $28,765 | $5,585 | $23,180 |
| 2018 | $3,030 | $28,435 | $0 | $0 |
| 2017 | $3,057 | $28,819 | $5,585 | $23,234 |
| 2016 | $3,044 | $28,764 | $4,783 | $23,981 |
| 2015 | $3,033 | $28,690 | $4,783 | $23,907 |
| 2014 | $2,893 | $27,401 | $4,783 | $22,618 |
Source: Public Records
Map
Nearby Homes
- 1216 Pine Valley
- 1212 Pine Valley
- 1233 Bradford Place
- 2713 Jills Trail
- 2605 Jills Trail
- 1812 Natchez Rd
- 2904 Canton Ln
- 604 NW 197th St
- 2324 Merlot Ct
- 2424 Semillon Way
- 900 Woodhollow Trail
- 804 NW 193rd St
- 821 NW 192nd Terrace
- 621 NW 188th St
- 2604 Jeannes Trail
- 19504 Fieldshire Dr
- 19917 Rambling Creek Dr
- 2321 Santa fe Cir
- 617 NW 186th St
- 928 NW 191st St
- 2700 Brenton Dr
- 2716 Brenton Dr
- 2632 Brenton Dr
- 2709 Brenton Dr
- 2724 Brenton Dr
- 2701 Brenton Dr
- 2633 W Danforth Rd
- 2717 Brenton Dr
- 2624 Brenton Dr
- 2732 Brenton Dr
- 2633 Brenton Dr
- 2725 Brenton Dr
- 2700 Richland Ave
- 2616 Brenton Dr
- 2625 Brenton Dr
- 2632 Richland Ave
- 2708 Richland Ave
- 2625 W Danforth Rd
- 2608 Brenton Dr
- 2624 Richland Ave