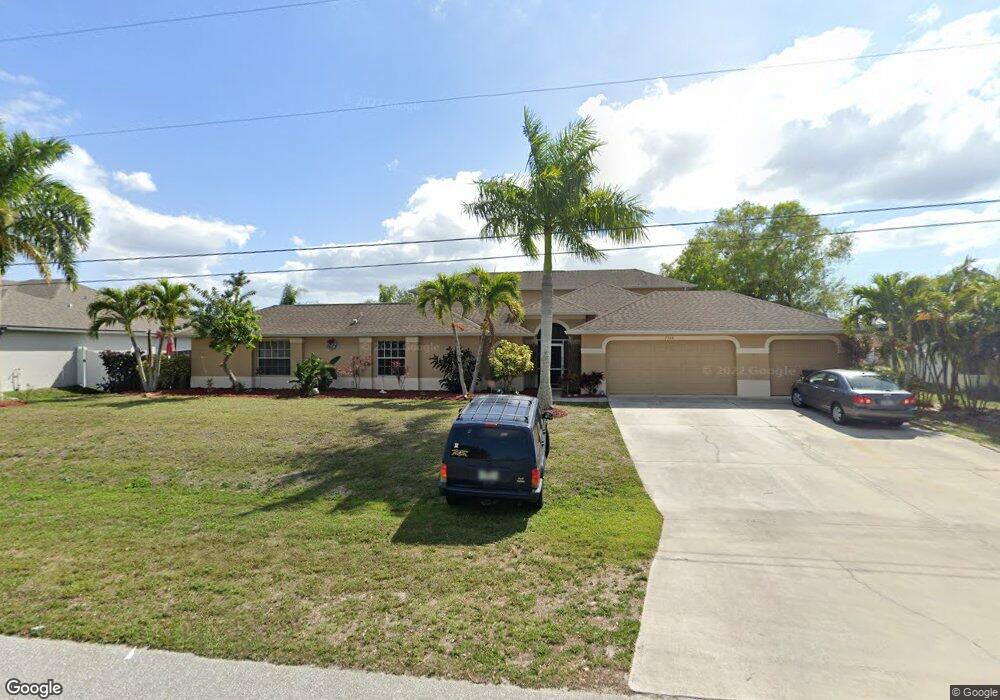
2708 Miracle Pkwy Unit 93 Cape Coral, FL 33914
Pelican NeighborhoodEstimated Value: $691,000 - $831,000
4
Beds
6
Baths
3,549
Sq Ft
$214/Sq Ft
Est. Value
About This Home
This home is located at 2708 Miracle Pkwy Unit 93, Cape Coral, FL 33914 and is currently estimated at $760,891, approximately $214 per square foot. 2708 Miracle Pkwy Unit 93 is a home located in Lee County with nearby schools including Cape Elementary School, Caloosa Elementary School, and Tropic Isles Elementary School.
Ownership History
Date
Name
Owned For
Owner Type
Purchase Details
Closed on
Dec 10, 2014
Sold by
Klepsch Charles and Klepsch Diane
Bought by
Klepsch Charles and Klepsch Diane
Current Estimated Value
Purchase Details
Closed on
Dec 10, 2013
Sold by
Klepsch Charles and Klepsch Diane
Bought by
Klpesch Charles and Klepsch Diane
Purchase Details
Closed on
Dec 29, 2011
Sold by
Klepsch Charles and Klepsch Diane
Bought by
Klepsch Charles and Klepsch Diane
Purchase Details
Closed on
Jan 28, 2011
Sold by
Bank Of America National Association
Bought by
Klepsch Charles and Klepsch Diane
Purchase Details
Closed on
Oct 13, 2010
Sold by
Dahistrom Richard C
Bought by
Bank Of America National Association
Purchase Details
Closed on
Feb 10, 2005
Sold by
Dahlstrom Richard C and Dahlstrom Judith D
Bought by
Dahlstrom Richard and Dahlstrom Judith D
Purchase Details
Closed on
Feb 21, 2003
Sold by
Bolliger Ernst
Bought by
Dahlstrom Richard
Create a Home Valuation Report for This Property
The Home Valuation Report is an in-depth analysis detailing your home's value as well as a comparison with similar homes in the area
Home Values in the Area
Average Home Value in this Area
Purchase History
| Date | Buyer | Sale Price | Title Company |
|---|---|---|---|
| Klepsch Charles | -- | Attorney | |
| Klpesch Charles | -- | Attorney | |
| Klepsch Charles | -- | Attorney | |
| Klepsch Charles | $180,000 | Landcastle Title Llc | |
| Bank Of America National Association | $110,100 | None Available | |
| Dahlstrom Richard | -- | First Cmnty Title Svcs Inc | |
| Dahlstrom Richard | $15,000 | -- |
Source: Public Records
Tax History Compared to Growth
Tax History
| Year | Tax Paid | Tax Assessment Tax Assessment Total Assessment is a certain percentage of the fair market value that is determined by local assessors to be the total taxable value of land and additions on the property. | Land | Improvement |
|---|---|---|---|---|
| 2025 | $5,910 | $437,764 | $110,224 | $290,041 |
| 2024 | $5,910 | $268,304 | -- | -- |
| 2023 | $5,770 | $255,489 | $0 | $0 |
| 2022 | $5,590 | $252,902 | $0 | $0 |
| 2021 | $5,667 | $366,477 | $48,413 | $318,064 |
| 2020 | $5,539 | $242,146 | $0 | $0 |
| 2019 | $5,411 | $236,702 | $0 | $0 |
| 2018 | $5,430 | $232,289 | $0 | $0 |
| 2017 | $5,393 | $227,511 | $0 | $0 |
| 2016 | $5,420 | $354,984 | $28,443 | $326,541 |
| 2015 | $5,443 | $300,177 | $19,945 | $280,232 |
| 2014 | $5,595 | $250,376 | $23,569 | $226,807 |
| 2013 | -- | $229,693 | $12,245 | $217,448 |
Source: Public Records
Map
Nearby Homes
- 2709 SW 25th St
- 2712 SW 25th St
- 2648 Somerville Loop Unit 1306
- 2733 SW 25th St
- 2620 Somerville Loop Unit 2004
- 2525 SW 27th Place
- 2602 SW 25th St Unit 29
- 2531 SW 27th Ave
- 2615 Somerville Loop Unit 307
- 2664 Somerville Loop Unit 901
- 2810 SW 25th St
- 2532 SW 26th Place
- 2611 Somerville Loop Unit 201
- 2527 SW 25th Terrace
- 2520 SW 25th St
- 2603 Somerville Loop Unit 106
- 2548 SW 26th Place
- 2510 Miracle Pkwy
- 2557 SW 27th Place
- 2536 SW 28th Place
- 2712 Miracle Pkwy
- 2400 SW 27th Ave
- 2705 SW 25th St
- 2701 SW 25th St
- 2732 Miracle Pkwy
- 2716 Miracle Pkwy Unit 18
- 2713 SW 25th St
- 2720 Miracle Pkwy
- 2405 SW 27th Ave
- 2401 SW 27th Ave
- 2409 SW 27th Ave
- 2708 SW 25th St
- 2712 SW 25th St Unit 20
- 2704 SW 25th St
- 2721 SW 25th St
- 2724 Miracle Pkwy
- 2700 SW 25th St
- 2413 SW 27th Ave
- 2720 SW 25th St
- 2725 SW 25th St