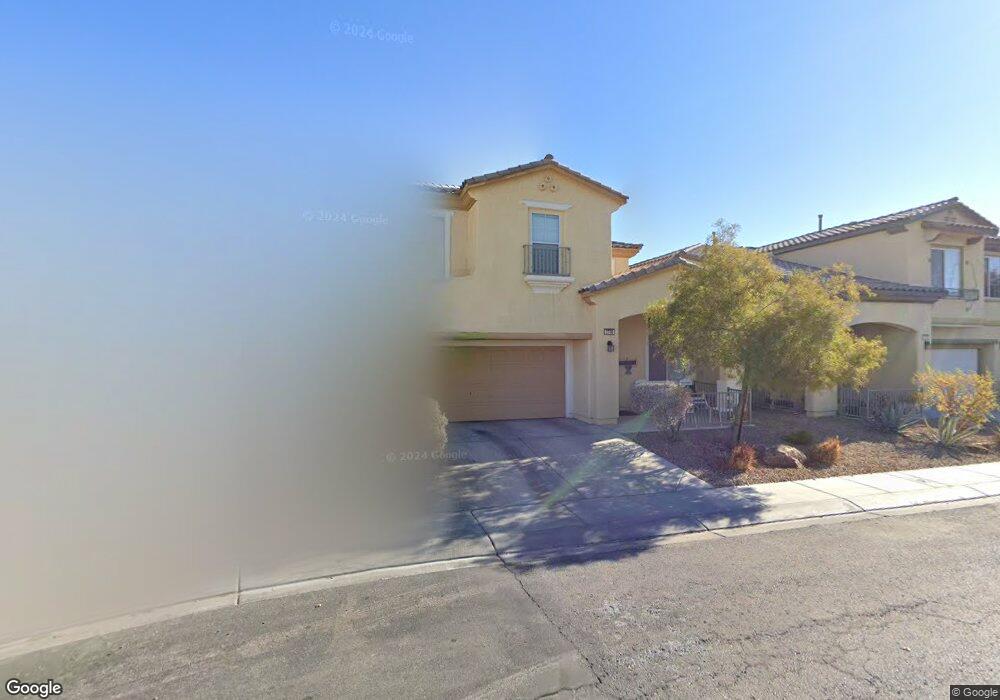
2708 Star Manor St North Las Vegas, NV 89030
Downtown North Las Vegas NeighborhoodEstimated Value: $447,691 - $484,000
4
Beds
3
Baths
2,906
Sq Ft
$159/Sq Ft
Est. Value
About This Home
This home is located at 2708 Star Manor St, North Las Vegas, NV 89030 and is currently estimated at $461,423, approximately $158 per square foot. 2708 Star Manor St is a home located in Clark County with nearby schools including H.P. Fitzgerald Elementary School, West Prepatory Academy At Charlles I West Hall Sec, and Cheyenne High School.
Ownership History
Date
Name
Owned For
Owner Type
Purchase Details
Closed on
Dec 20, 2019
Sold by
Wright Freddie R
Bought by
Wright Freddie R and Manda Wright Linda S
Current Estimated Value
Purchase Details
Closed on
Jul 9, 2019
Sold by
Manor Wright Linda V
Bought by
Wright Freddie R
Purchase Details
Closed on
Sep 22, 2016
Sold by
Wright Freddie R
Bought by
Wright Freddie R and Manor Wright Linda S
Purchase Details
Closed on
Jun 4, 2012
Sold by
Manor Wright Linda S
Bought by
Wright Freddie R
Purchase Details
Closed on
Sep 28, 2007
Sold by
Tousa Homes Inc
Bought by
Wright Freddie R and Wright Linda S Manor
Home Financials for this Owner
Home Financials are based on the most recent Mortgage that was taken out on this home.
Original Mortgage
$294,008
Interest Rate
6.61%
Mortgage Type
Unknown
Create a Home Valuation Report for This Property
The Home Valuation Report is an in-depth analysis detailing your home's value as well as a comparison with similar homes in the area
Home Values in the Area
Average Home Value in this Area
Purchase History
| Date | Buyer | Sale Price | Title Company |
|---|---|---|---|
| Wright Freddie R | -- | None Available | |
| Wright Freddie R | -- | None Available | |
| Wright Freddie R | -- | None Available | |
| Wright Freddie R | -- | None Available | |
| Wright Freddie R | $298,873 | Community Title |
Source: Public Records
Mortgage History
| Date | Status | Borrower | Loan Amount |
|---|---|---|---|
| Previous Owner | Wright Freddie R | $294,008 |
Source: Public Records
Tax History Compared to Growth
Tax History
| Year | Tax Paid | Tax Assessment Tax Assessment Total Assessment is a certain percentage of the fair market value that is determined by local assessors to be the total taxable value of land and additions on the property. | Land | Improvement |
|---|---|---|---|---|
| 2025 | $1,877 | $154,133 | $29,750 | $124,383 |
| 2024 | $1,823 | $154,133 | $29,750 | $124,383 |
| 2023 | $1,823 | $147,074 | $30,100 | $116,974 |
| 2022 | $1,770 | $123,257 | $25,200 | $98,057 |
| 2021 | $1,797 | $110,624 | $23,800 | $86,824 |
| 2020 | $1,666 | $97,489 | $23,800 | $73,689 |
| 2019 | $1,561 | $98,937 | $17,500 | $81,437 |
| 2018 | $1,490 | $86,543 | $15,400 | $71,143 |
| 2017 | $2,611 | $77,838 | $11,550 | $66,288 |
| 2016 | $1,395 | $56,728 | $8,750 | $47,978 |
| 2015 | $1,392 | $50,529 | $7,000 | $43,529 |
| 2014 | $1,348 | $42,407 | $3,500 | $38,907 |
Source: Public Records
Map
Nearby Homes
- 1217 Star Meadow Dr
- 2617 Star Manor St Unit II
- 2621 Rainbow Glow St
- 0 Windsor Ave Unit 2711938
- 0 Windsor Ave
- 2539 Tuskegee St
- 00
- 00 Duquesne Ave
- 4 Duquesne Ave
- 2537 Page St
- 0 N Revere St Unit 2730306
- 0 Plymouth St
- 0 Tbd Unit 2726623
- 0 Wisteria Ave
- 0 W Piper Ave
- 2413 Copperbelt St
- 1116 Boylston Ave
- 1120 Boylston Ave
- 0 Reverend Wilson Ave Unit 2710235
- 0 Reverend Wilson Ave Unit 2708306
- 2704 Star Manor St
- 2712 Star Manor St
- 2656 Star Manor St
- 2716 Star Manor St
- 2709 Concord St
- 2713 Concord St
- 2705 Concord St
- 2717 Concord St
- 2657 Concord St
- 2652 Star Manor St
- 1204 Stormy Day Ave
- 1205 Star Meadow Dr
- 1129 Star Meadow Dr
- 2653 Concord St
- 2657 Star Manor St
- 1209 Star Meadow Dr
- 1125 Star Meadow Dr
- 2648 Star Manor St Unit II
- 1208 Stormy Day Ave
- 2653 Star Manor St