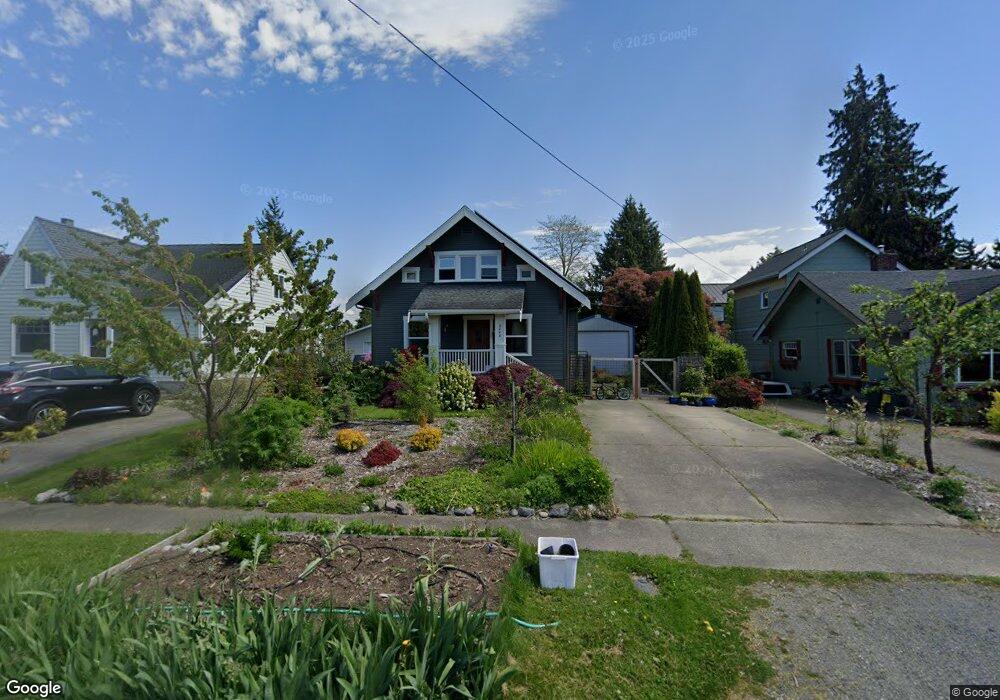
2708 Walnut St Bellingham, WA 98225
Columbia NeighborhoodEstimated Value: $577,000 - $742,000
3
Beds
2
Baths
1,084
Sq Ft
$601/Sq Ft
Est. Value
About This Home
This home is located at 2708 Walnut St, Bellingham, WA 98225 and is currently estimated at $651,452, approximately $600 per square foot. 2708 Walnut St is a home located in Whatcom County with nearby schools including Columbia Elementary School, Whatcom Middle School, and Bellingham High School.
Ownership History
Date
Name
Owned For
Owner Type
Purchase Details
Closed on
Dec 17, 2015
Sold by
Macke Andreas H
Bought by
Westring Mary and Weeks Jennifer
Current Estimated Value
Home Financials for this Owner
Home Financials are based on the most recent Mortgage that was taken out on this home.
Original Mortgage
$272,000
Outstanding Balance
$109,985
Interest Rate
3.13%
Mortgage Type
New Conventional
Estimated Equity
$541,467
Purchase Details
Closed on
Mar 29, 2011
Sold by
Macke Jennifer W
Bought by
Macke Andreas H
Home Financials for this Owner
Home Financials are based on the most recent Mortgage that was taken out on this home.
Original Mortgage
$201,900
Interest Rate
4.96%
Mortgage Type
New Conventional
Purchase Details
Closed on
Jul 16, 2001
Sold by
Brennick Daryl D and Brennick Joy C
Bought by
Maxwell R Phillip and Maxwell Tracy A
Home Financials for this Owner
Home Financials are based on the most recent Mortgage that was taken out on this home.
Original Mortgage
$116,307
Interest Rate
7%
Mortgage Type
Seller Take Back
Create a Home Valuation Report for This Property
The Home Valuation Report is an in-depth analysis detailing your home's value as well as a comparison with similar homes in the area
Home Values in the Area
Average Home Value in this Area
Purchase History
| Date | Buyer | Sale Price | Title Company |
|---|---|---|---|
| Westring Mary | $340,000 | Chicago Title Insurance | |
| Macke Andreas H | -- | Whatcom Land Title | |
| Macke Andreas H | $252,656 | Whatcom Land Title | |
| Maxwell R Phillip | -- | -- |
Source: Public Records
Mortgage History
| Date | Status | Borrower | Loan Amount |
|---|---|---|---|
| Open | Westring Mary | $272,000 | |
| Previous Owner | Macke Andreas H | $201,900 | |
| Previous Owner | Maxwell R Phillip | $116,307 |
Source: Public Records
Tax History Compared to Growth
Tax History
| Year | Tax Paid | Tax Assessment Tax Assessment Total Assessment is a certain percentage of the fair market value that is determined by local assessors to be the total taxable value of land and additions on the property. | Land | Improvement |
|---|---|---|---|---|
| 2024 | $4,469 | $559,925 | $270,928 | $288,997 |
| 2023 | $4,469 | $574,177 | $277,824 | $296,353 |
| 2022 | $3,317 | $494,981 | $239,504 | $255,477 |
| 2021 | $3,254 | $357,125 | $172,800 | $184,325 |
| 2020 | $3,090 | $330,671 | $160,000 | $170,671 |
| 2019 | $2,766 | $303,437 | $124,778 | $178,659 |
| 2018 | $2,786 | $272,380 | $112,028 | $160,352 |
| 2017 | $2,402 | $234,510 | $96,450 | $138,060 |
| 2016 | $2,102 | $211,364 | $86,550 | $124,814 |
| 2015 | $2,013 | $192,556 | $79,050 | $113,506 |
| 2014 | -- | $178,420 | $75,000 | $103,420 |
| 2013 | -- | $175,946 | $73,500 | $102,446 |
Source: Public Records
Map
Nearby Homes
- 2805 Walnut St
- 2600 Elm St
- 2500 Meridian St
- 3018 Elm St
- 3008 Meridian St
- 1508 E Maplewood Ave
- 1800 J St
- 2218 Jaeger St
- 3000 Firwood Ave
- 1410 J St
- 1315 Astor St
- 1200 W Holly St
- 2500 Cornwall Ave
- 2715 W Maplewood Ave Unit 122
- 3330 Northwest Ave
- 3350 Northwest Ave Unit 1102
- 2829 Cottonwood Ave
- 2019 Cornwall Ave
- 3025 Cedarwood Ave
- 3045 Eldridge Ave Unit A
- 2712 Walnut St
- 2700 Walnut St
- 1510 W Connecticut St
- 2716 Walnut St
- 2720 Walnut St
- 2709 Walnut St
- 1508 W Connecticut St
- 2705 Walnut St
- 2715 Walnut St
- 2701 Walnut St
- 2724 Walnut St
- 2630 Walnut St
- 2721 Walnut St
- 2631 Park St
- 1416 W Connecticut St
- 2728 Walnut St
- 2727 Walnut St
- 2624 Walnut St
- 2631 Walnut St