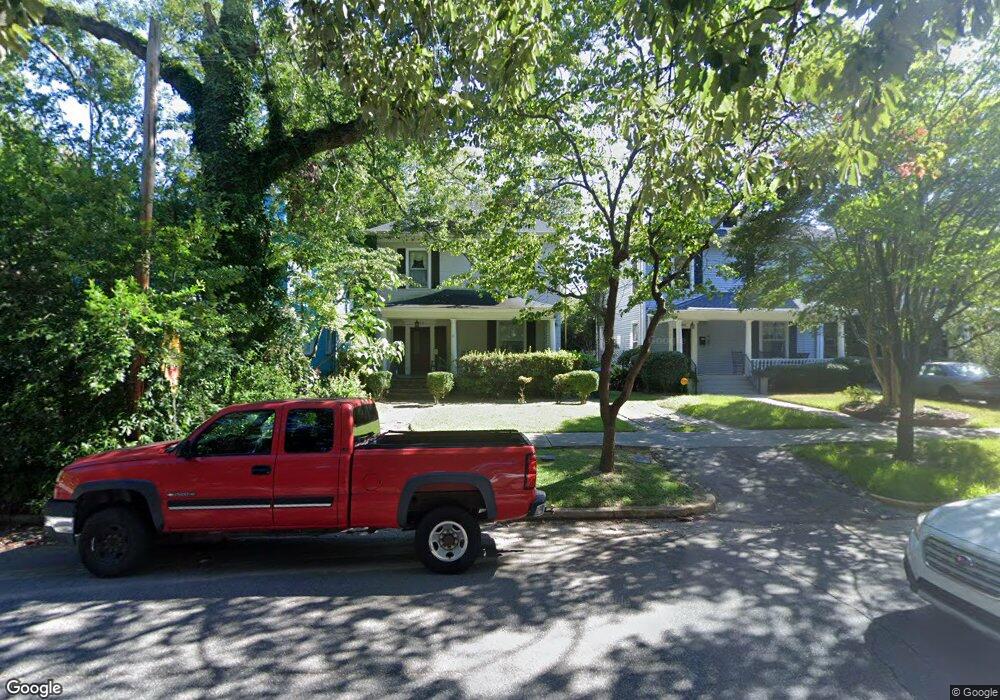
2708 Wheat St Columbia, SC 29205
Rosewood NeighborhoodEstimated Value: $418,650 - $497,000
3
Beds
2
Baths
1,692
Sq Ft
$276/Sq Ft
Est. Value
About This Home
This home is located at 2708 Wheat St, Columbia, SC 29205 and is currently estimated at $467,413, approximately $276 per square foot. 2708 Wheat St is a home located in Richland County with nearby schools including A. C. Moore Elementary School, Hand Middle School, and Dreher High School.
Ownership History
Date
Name
Owned For
Owner Type
Purchase Details
Closed on
May 30, 2017
Sold by
Summa Gayla L J and Summa Antonio
Bought by
Potts Carter R
Current Estimated Value
Home Financials for this Owner
Home Financials are based on the most recent Mortgage that was taken out on this home.
Original Mortgage
$212,000
Outstanding Balance
$176,629
Interest Rate
4.08%
Mortgage Type
New Conventional
Estimated Equity
$290,784
Create a Home Valuation Report for This Property
The Home Valuation Report is an in-depth analysis detailing your home's value as well as a comparison with similar homes in the area
Home Values in the Area
Average Home Value in this Area
Purchase History
| Date | Buyer | Sale Price | Title Company |
|---|---|---|---|
| Potts Carter R | $265,000 | None Available |
Source: Public Records
Mortgage History
| Date | Status | Borrower | Loan Amount |
|---|---|---|---|
| Open | Potts Carter R | $212,000 |
Source: Public Records
Tax History
| Year | Tax Paid | Tax Assessment Tax Assessment Total Assessment is a certain percentage of the fair market value that is determined by local assessors to be the total taxable value of land and additions on the property. | Land | Improvement |
|---|---|---|---|---|
| 2024 | $2,179 | $304,800 | $0 | $0 |
| 2023 | $2,102 | $10,600 | $0 | $0 |
| 2022 | $1,922 | $265,000 | $75,000 | $190,000 |
| 2021 | $1,985 | $10,600 | $0 | $0 |
| 2020 | $2,094 | $10,600 | $0 | $0 |
| 2019 | $2,108 | $10,600 | $0 | $0 |
| 2018 | $2,157 | $10,600 | $0 | $0 |
| 2017 | $1,561 | $7,880 | $0 | $0 |
| 2016 | $1,506 | $7,880 | $0 | $0 |
| 2015 | $1,553 | $8,130 | $0 | $0 |
| 2014 | $1,552 | $203,300 | $0 | $0 |
| 2013 | -- | $8,130 | $0 | $0 |
Source: Public Records
Map
Nearby Homes
- 619 King St Unit 905
- 2832 Wheat St
- 705 Maple St Unit 203
- 705 Maple St Unit F204
- 801 King St Unit "L"
- 2709 Preston St
- 528 Capitol Place
- 130 S Shandon St
- 3210 Wheat St
- 3219 Blossom St
- 405 Waccamaw Ave
- 2584 Cherry St
- 102 Rio Rose Cir
- 2218 Rosewood Dr
- 114 Saluda Ave
- 1125 Hagood Ave
- 418 Edisto Ave
- 3210 Cannon St
- 121 Saluda Ave
- 2313 Greene St
Your Personal Tour Guide
Ask me questions while you tour the home.