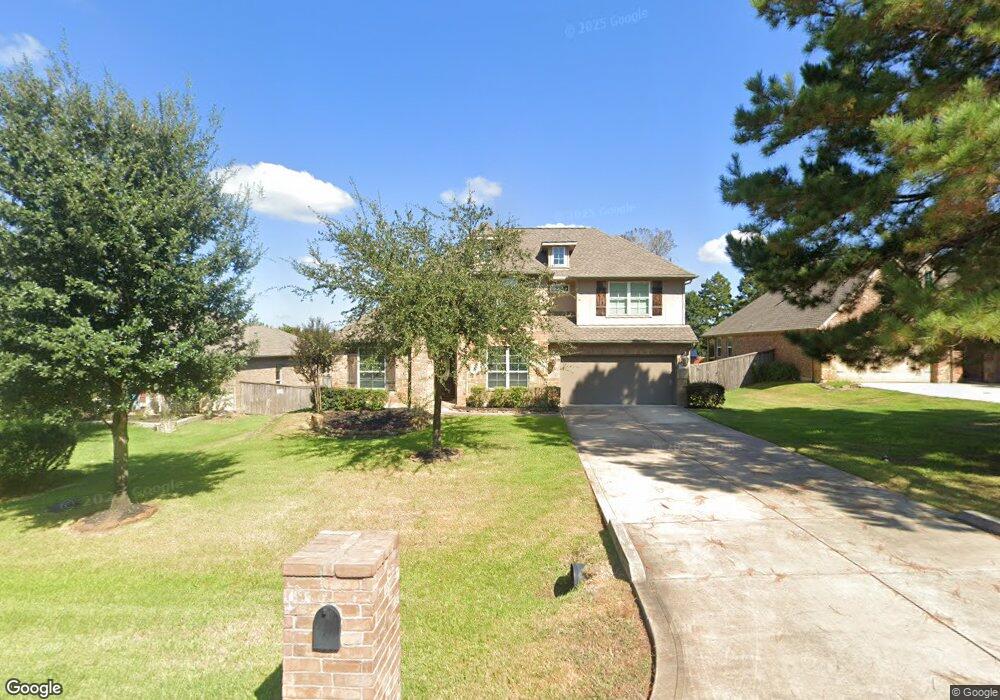
27080 Palo Pinto Trail Magnolia, TX 77355
Estimated Value: $406,723 - $516,000
4
Beds
3
Baths
3,246
Sq Ft
$136/Sq Ft
Est. Value
About This Home
This home is located at 27080 Palo Pinto Trail, Magnolia, TX 77355 and is currently estimated at $442,931, approximately $136 per square foot. 27080 Palo Pinto Trail is a home located in Montgomery County with nearby schools including Willie E. Williams Elementary School, Magnolia Sixth Grade Campus, and Magnolia Junior High School.
Ownership History
Date
Name
Owned For
Owner Type
Purchase Details
Closed on
Mar 4, 2019
Sold by
Harris Theresa L and Reddic Tyson J
Bought by
Swalm Chris and Swalm Shannon
Current Estimated Value
Home Financials for this Owner
Home Financials are based on the most recent Mortgage that was taken out on this home.
Original Mortgage
$301,818
Outstanding Balance
$265,349
Interest Rate
4.4%
Mortgage Type
New Conventional
Estimated Equity
$177,582
Purchase Details
Closed on
Oct 30, 2014
Sold by
Rvision Homes Llc
Bought by
Harris Theresa L and Reddic Tyson J
Home Financials for this Owner
Home Financials are based on the most recent Mortgage that was taken out on this home.
Original Mortgage
$271,835
Interest Rate
4.25%
Mortgage Type
FHA
Purchase Details
Closed on
Nov 25, 2013
Sold by
White Oak Developers Inc
Bought by
Rvision Homes Llc
Create a Home Valuation Report for This Property
The Home Valuation Report is an in-depth analysis detailing your home's value as well as a comparison with similar homes in the area
Home Values in the Area
Average Home Value in this Area
Purchase History
| Date | Buyer | Sale Price | Title Company |
|---|---|---|---|
| Swalm Chris | -- | Fidelity National Title | |
| Harris Theresa L | -- | Fidelity National Title | |
| Rvision Homes Llc | -- | Fidelity National Title |
Source: Public Records
Mortgage History
| Date | Status | Borrower | Loan Amount |
|---|---|---|---|
| Open | Swalm Chris | $301,818 | |
| Previous Owner | Harris Theresa L | $271,835 |
Source: Public Records
Tax History Compared to Growth
Tax History
| Year | Tax Paid | Tax Assessment Tax Assessment Total Assessment is a certain percentage of the fair market value that is determined by local assessors to be the total taxable value of land and additions on the property. | Land | Improvement |
|---|---|---|---|---|
| 2025 | $4,698 | $418,007 | -- | -- |
| 2024 | $4,170 | $380,006 | -- | -- |
| 2023 | $4,170 | $345,460 | $27,270 | $411,180 |
| 2022 | $5,542 | $314,050 | $27,270 | $387,190 |
| 2021 | $5,307 | $285,500 | $27,270 | $258,230 |
| 2020 | $5,970 | $295,000 | $27,270 | $267,730 |
| 2019 | $6,042 | $300,000 | $27,270 | $272,730 |
| 2018 | $6,417 | $303,540 | $12,950 | $290,590 |
| 2017 | $6,160 | $290,520 | $12,950 | $290,590 |
| 2016 | $5,600 | $264,110 | $12,950 | $251,160 |
| 2015 | $214 | $275,880 | $12,950 | $262,930 |
| 2014 | $214 | $10,000 | $10,000 | $0 |
Source: Public Records
Map
Nearby Homes
- 18846 Maverick Ranch Rd W
- 34310 High Point Dr
- 34030 Old Hempstead Rd
- 19135 Ranchcrest Dr
- 32210 Park Meadow Pass
- 21742 Whielden Heights Way
- 21738 Whielden Heights Way
- 21710 Whielden Heights Way
- 21706 Whielden Heights Way
- 537 Ruel Ln
- 19016 Magnolia Willow Ln
- 32118 River Park Dr
- 19032 Magnolia Willow Ln
- Hanford Plan at Emory Glen
- Davenport Plan at Emory Glen
- Fordham Plan at Emory Glen
- Kingston Plan at Emory Glen
- Surrey Plan at Emory Glen
- Brent Plan at Emory Glen
- Redford Plan at Emory Glen
- 27084 Palo Pinto Trail
- 27076 Palo Pinto Trail
- 27072 Palo Pinto Trail
- 27081 Palo Pinto Trail
- 27044 Palo Pinto Trail
- 27048 Palo Pinto Trail
- 27073 Palo Pinto Trail
- 27040 Palo Pinto Trail
- 27077 Palo Pinto Trail
- 27085 Palo Pinto Trail
- 27069 Palo Pinto Trail
- 27065 Palo Pinto Trail
- 27036 Palo Pinto Trail
- 27061 Palo Pinto Trail
- 27049 Palo Pinto Trail
- 27053 Palo Pinto Trail
- 27045 Palo Pinto Trail
- 27032 Palo Pinto Trail
- 27041 Palo Pinto Trail
- 27057 Palo Pinto Trail