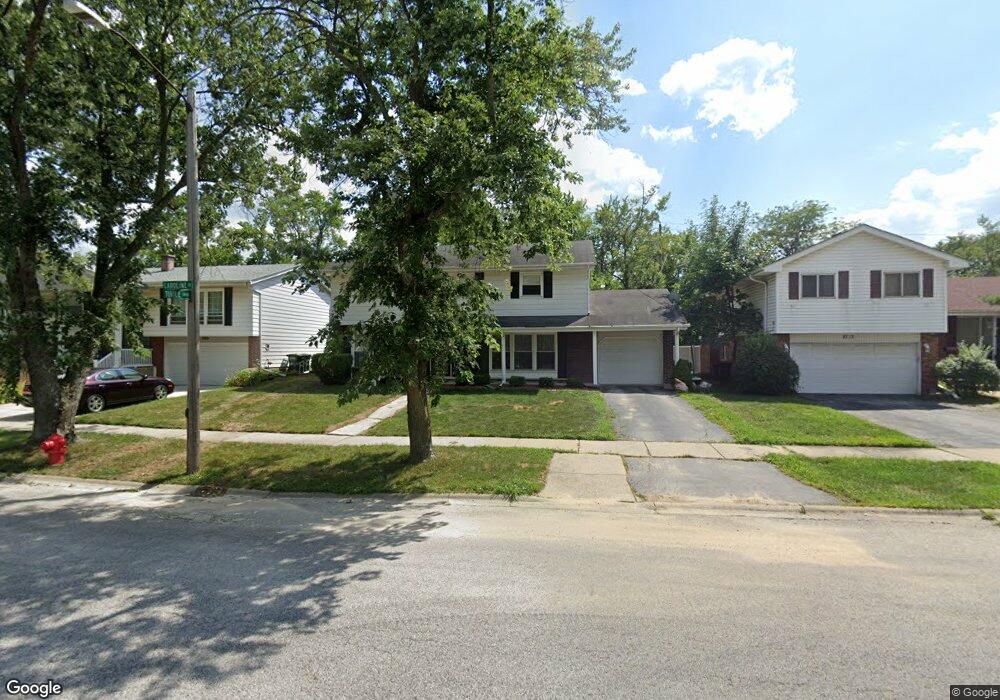
2709 Caroline Dr Homewood, IL 60430
Estimated Value: $315,322 - $363,000
4
Beds
3
Baths
2,163
Sq Ft
$158/Sq Ft
Est. Value
About This Home
This home is located at 2709 Caroline Dr, Homewood, IL 60430 and is currently estimated at $342,331, approximately $158 per square foot. 2709 Caroline Dr is a home located in Cook County with nearby schools including Willow Elementary School, Winston Churchill School, and James Hart School.
Ownership History
Date
Name
Owned For
Owner Type
Purchase Details
Closed on
Nov 30, 2009
Sold by
Keorpes Jim
Bought by
Peer Calvin and Peer Kenisha T
Current Estimated Value
Home Financials for this Owner
Home Financials are based on the most recent Mortgage that was taken out on this home.
Original Mortgage
$186,688
Outstanding Balance
$122,584
Interest Rate
5.11%
Mortgage Type
FHA
Estimated Equity
$219,747
Purchase Details
Closed on
Oct 30, 2008
Sold by
Accredited Home Lenders Incorporated
Bought by
Keorpes Jim
Purchase Details
Closed on
Jan 24, 2008
Sold by
Thurman Charles Nehemiyah
Bought by
Accredited Home Lenders Inc
Purchase Details
Closed on
Oct 21, 2005
Sold by
Mettler Kenneth W and Mettler Diane E
Bought by
Thurman Charles Nehemiyah
Home Financials for this Owner
Home Financials are based on the most recent Mortgage that was taken out on this home.
Original Mortgage
$170,400
Interest Rate
7.95%
Mortgage Type
Fannie Mae Freddie Mac
Create a Home Valuation Report for This Property
The Home Valuation Report is an in-depth analysis detailing your home's value as well as a comparison with similar homes in the area
Home Values in the Area
Average Home Value in this Area
Purchase History
| Date | Buyer | Sale Price | Title Company |
|---|---|---|---|
| Peer Calvin | $195,000 | Attorneys Title Guaranty Fun | |
| Keorpes Jim | $75,000 | First American Title | |
| Accredited Home Lenders Inc | -- | None Available | |
| Thurman Charles Nehemiyah | $213,000 | Chicago Title Insurance Comp |
Source: Public Records
Mortgage History
| Date | Status | Borrower | Loan Amount |
|---|---|---|---|
| Open | Peer Calvin | $186,688 | |
| Previous Owner | Thurman Charles Nehemiyah | $170,400 |
Source: Public Records
Tax History Compared to Growth
Tax History
| Year | Tax Paid | Tax Assessment Tax Assessment Total Assessment is a certain percentage of the fair market value that is determined by local assessors to be the total taxable value of land and additions on the property. | Land | Improvement |
|---|---|---|---|---|
| 2024 | $9,664 | $27,000 | $4,266 | $22,734 |
| 2023 | $6,856 | $27,000 | $4,266 | $22,734 |
| 2022 | $6,856 | $16,857 | $3,656 | $13,201 |
| 2021 | $6,434 | $16,856 | $3,656 | $13,200 |
| 2020 | $6,358 | $16,856 | $3,656 | $13,200 |
| 2019 | $7,962 | $20,034 | $3,250 | $16,784 |
| 2018 | $7,700 | $20,034 | $3,250 | $16,784 |
| 2017 | $7,751 | $20,034 | $3,250 | $16,784 |
| 2016 | $6,987 | $17,165 | $2,843 | $14,322 |
| 2015 | $6,877 | $17,165 | $2,843 | $14,322 |
| 2014 | $6,771 | $17,165 | $2,843 | $14,322 |
| 2013 | $6,795 | $18,555 | $2,843 | $15,712 |
Source: Public Records
Map
Nearby Homes
- 18024 Marlin Ln
- 17805 Dogwood Ln
- 17803 Dogwood Ln
- 17714 Dogwood Ln
- 2612 Turtle Creek Dr
- 17804 Pebblewood Ln
- 2805 Knollwood Place
- 2908 Buttonwood Walk
- 2533 Hickory Rd
- 2711 Larkspur Ln
- 2722 Cherrywood Ln
- 17613 Grandview Dr
- 17622 Oakwood Dr
- 17504 Danielle Ct
- 18210 Perth Ave
- 5 E Carriageway Dr Unit 210
- 2612 175th St
- 17640 Golfview Ave
- 2347 Spruce Rd
- 7 E Carriageway Dr Unit 101
- 2713 Caroline Dr
- 2705 Caroline Dr
- 2717 Caroline Dr
- 2701 Caroline Dr
- 17900 Governors Hwy
- 2714 Hollydale Dr
- 2714 Caroline Dr
- 2721 Caroline Dr
- 2718 Hollydale Dr
- 2700 Caroline Dr
- 2708 Hollydale Dr
- 2722 Hollydale Dr
- 17824 Turtlecreek Dr
- 17906 Governors Hwy
- 2720 Caroline Dr
- 2725 Caroline Dr
- 17825 Turtlecreek Dr
- 2726 Hollydale Dr
- 17825 Larkspur Ln
- 17818 Turtlecreek Dr