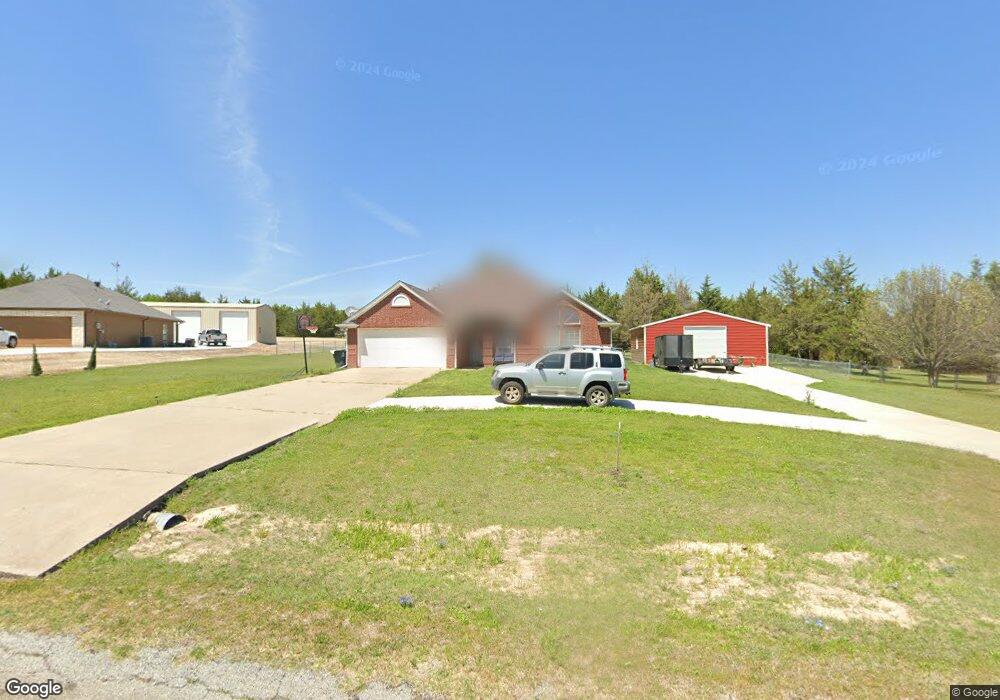
2709 Cedar Park Sherman, TX 75090
Estimated Value: $423,000
4
Beds
2
Baths
1,569
Sq Ft
$270/Sq Ft
Est. Value
About This Home
This home is located at 2709 Cedar Park, Sherman, TX 75090 and is currently estimated at $423,000, approximately $269 per square foot. 2709 Cedar Park is a home located in Grayson County with nearby schools including Percy W. Neblett Elementary School, Dillingham Intermediate School, and Piner Middle School.
Ownership History
Date
Name
Owned For
Owner Type
Purchase Details
Closed on
Apr 23, 2021
Sold by
Salazar Barbara Ann and Estate Of Larry Gene Tanner
Bought by
Phillips Jon Mark
Current Estimated Value
Home Financials for this Owner
Home Financials are based on the most recent Mortgage that was taken out on this home.
Original Mortgage
$259,825
Outstanding Balance
$234,590
Interest Rate
3%
Mortgage Type
New Conventional
Estimated Equity
$188,410
Purchase Details
Closed on
Mar 30, 2020
Sold by
Ramirez Luis F and Ramirez Maria E
Bought by
Tanner Larry
Home Financials for this Owner
Home Financials are based on the most recent Mortgage that was taken out on this home.
Original Mortgage
$230,000
Interest Rate
3.4%
Mortgage Type
VA
Create a Home Valuation Report for This Property
The Home Valuation Report is an in-depth analysis detailing your home's value as well as a comparison with similar homes in the area
Home Values in the Area
Average Home Value in this Area
Purchase History
| Date | Buyer | Sale Price | Title Company |
|---|---|---|---|
| Phillips Jon Mark | -- | First American Mortgage Sln | |
| Tanner Larry | -- | Red River Title Co |
Source: Public Records
Mortgage History
| Date | Status | Borrower | Loan Amount |
|---|---|---|---|
| Open | Phillips Jon Mark | $259,825 | |
| Previous Owner | Tanner Larry | $230,000 |
Source: Public Records
Tax History Compared to Growth
Tax History
| Year | Tax Paid | Tax Assessment Tax Assessment Total Assessment is a certain percentage of the fair market value that is determined by local assessors to be the total taxable value of land and additions on the property. | Land | Improvement |
|---|---|---|---|---|
| 2025 | $7,614 | $314,453 | $111,318 | $203,135 |
| 2024 | $7,614 | $347,145 | $103,455 | $243,690 |
| 2023 | $6,585 | $299,902 | $59,590 | $240,312 |
| 2022 | $6,843 | $291,963 | $59,590 | $232,373 |
| 2021 | $5,692 | $227,098 | $44,279 | $182,819 |
| 2020 | $5,531 | $216,434 | $38,236 | $178,198 |
| 2019 | $5,164 | $201,869 | $35,467 | $166,402 |
| 2018 | $4,370 | $184,453 | $35,467 | $148,986 |
| 2017 | $3,942 | $176,529 | $35,467 | $141,062 |
| 2016 | $4,473 | $155,774 | $23,877 | $131,897 |
| 2015 | $2,762 | $130,861 | $23,877 | $106,984 |
| 2014 | $2,889 | $130,123 | $23,877 | $106,246 |
Source: Public Records
Map
Nearby Homes
- TBD Sistrunk St
- 3707 Heatherwood Ln
- 4353 Cox St
- 3706 Heatherwood Ln
- 00000 Texoma Pkwy
- 000 Texoma Pkwy
- 1530 Texoma Pkwy
- 0000 Texoma Pkwy
- 4779 Sistrunk St
- 4322 Carnation Dr
- 4400 Carnation Dr
- 4404 Carnation Dr
- 4408 Carnation Dr
- 4412 Carnation Dr
- 4420 Carnation Dr
- 920 Jefferson Way
- Evans Plan at Sweetwater Springs
- Peterson Plan at Sweetwater Springs
- 913 Jefferson Way
- Harrison Plan at Sweetwater Springs
- 2709 Cedar Park
- 2705 Cedar Park
- 2713 Cedar Park
- 2708 Cedar Park
- 2701 Cedar Park
- 2712 Cedar Park
- 4005 Cox St
- 2717 Cedar Park
- 4004 Cox St
- 4009 Cox St
- 4010 Cox St
- 3809 Crimsonwood Dr
- TBD Crimson Wood
- 2716 Cedar Park
- 3808 Crimsonwood Dr
- 3814 Crimsonwood Dr
- 4014 Cox St
- 4015 Cox St
- 2721 Cedar Park
- 2626 Dripping Springs Rd